
Fig 7.
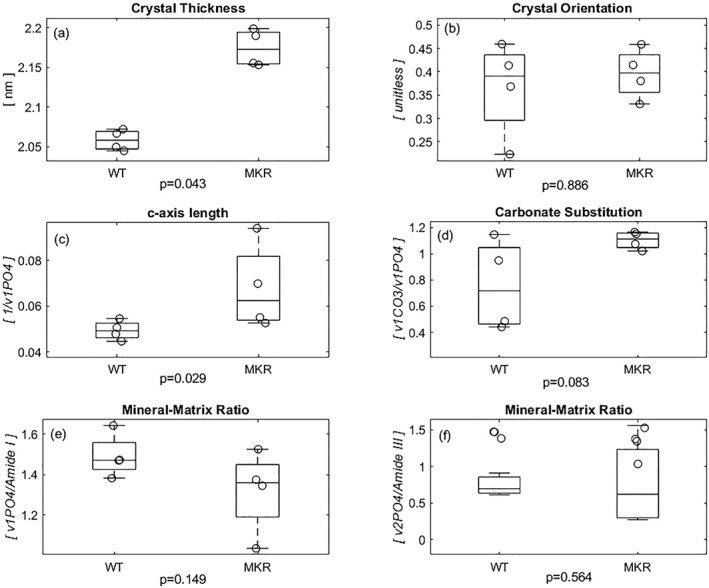
(A) The hydroxyapatite crystals within the MKR femurs' collagen fibrils were significantly thicker than those in the WT group. (B) Because crystal orientation ranges from 0 to 1, both the crystals in the diabetic and WT controls (ψ < 0.5) indicate orientation parallel to the axis of the bone, though not significantly different from each other. (C) The diabetic MKR group exhibited a significantly increased c‐axis length, which stems from its inverse relationship with the relative phosphate content of the hydroxyapatite crystals. (D) In addition to the increased growth, the MKR femora trended to exhibit more type‐B carbonate substitution within the inorganic when compared to the WT controls. (E) There was no difference in the relative amount of mineral determined by Raman peak of phosphate normalized to the amount of matrix determined by the Raman peak of Amide I. (F) There is no significant difference in the relative amount of mineral determined by Raman peak of less polarization‐dependent phosphate normalized to Amide III Raman peak representing the less polarization‐dependent matrix content. [Correction added on 15 February 2022, after first online publication: Figure 7 has been replaced]