
Fig 9.
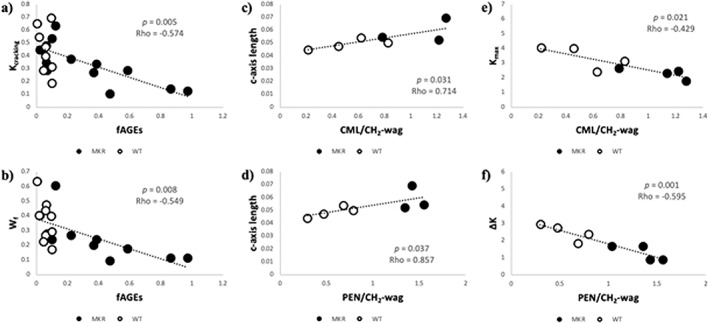
(A) Within the MKR group (black‐filled dots) there was a negative correlation between the cracking toughness and the accumulation of fAGEs, although these values do not correlate in the WT controls (black outlined, white filled dots). (B) There was a similar negative correlation between fAGEs and work‐to‐failure seen in the MKR group that was again absent in the WT controls. (C) The c‐axis length, a marker of bone mineral quality, had a positive correlation with CML/CH2‐wag between the groups. (D) The c‐axis length also had a positive correlation with PEN/CH2‐wag between the groups. (E) The maximum toughness had a negative correlation with CML/CH2‐wag which served a best predictor of maximum toughness. (F) The toughening effect had a negative correlation with PEN/CH2‐wag, which served as the best predictor of toughening effect (ΔK).