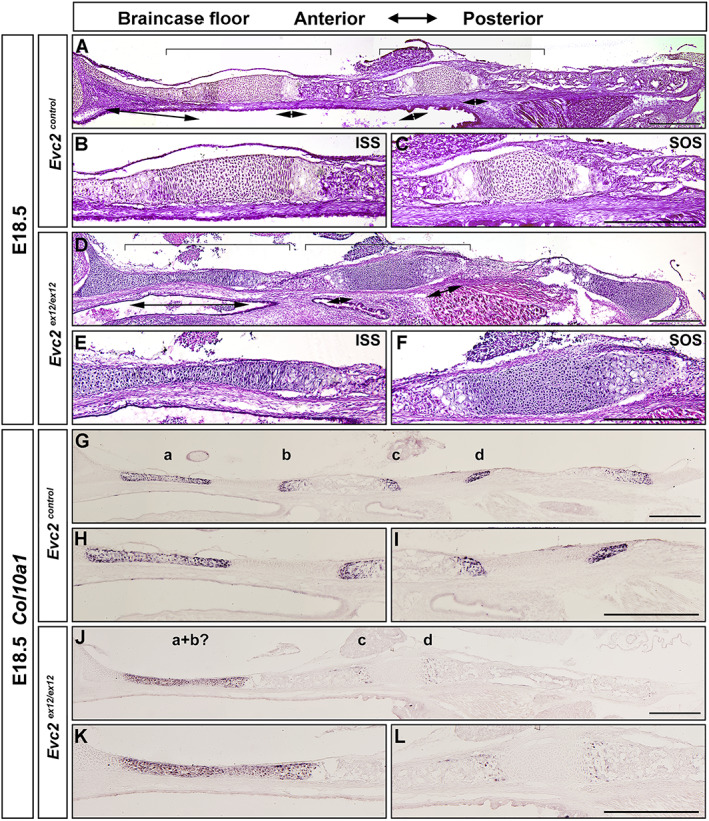
Fig. 3.

Evc2 loss of function leads to shortened braincase floors and premature fusion of ISS at E18.5. Control and Evc2 mutant braincase floors at E18.5 (A, D) are shown. The enlarged ISS and SOS for controls (B, C) and mutants (E, F) are shown. Expressions of Col10a1 in controls (G–I) and Evc2 mutant (J–L) skull at E18.5 were examined by in situ hybridization. Hypertrophic zones for PS (a), ISS‐P (b), SOS‐A (c), and SOS‐P (d) are shown. The enlarged ISS and SOS for controls (H, I) and mutant (K, L) are shown. Pictures shown are representative of comparisons of 6 controls with mutants. Scale bar = 200 μm.
