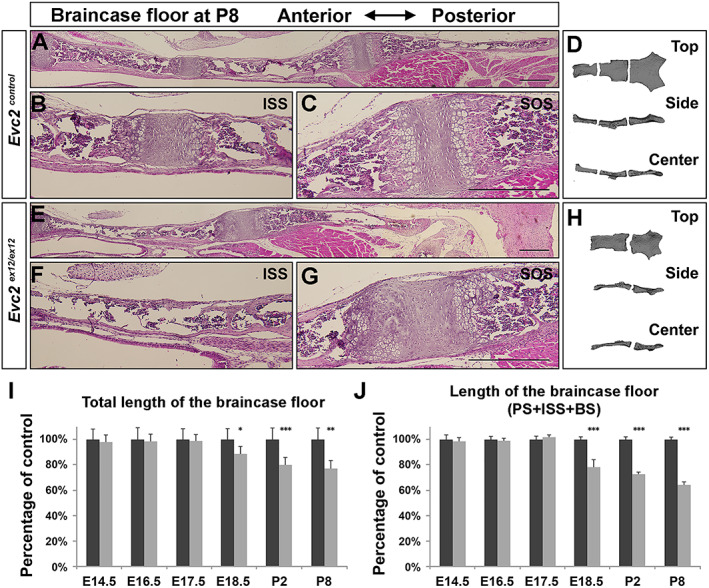
Fig. 4.

Evc2 loss of function leads to fused ISS at P8. Histologic assessment of control (A) and Evc2 mutant (E) skull bases at P8 are shown. The ISS of control (B), a presumptive ISS of mutant (F), and the SOS of control (C) and mutant (G) are shown. Three‐dimensional reconstructed models of control (D) and mutant (H) skull reconstructed from micro‐CT scan are shown. The length of the braincase floor (I) and length of the anterior braincase floor (J) are shown as the percentage of controls. (n = 6, *p < 0.05, **p < 0.01, error bars denote standard deviations.)
