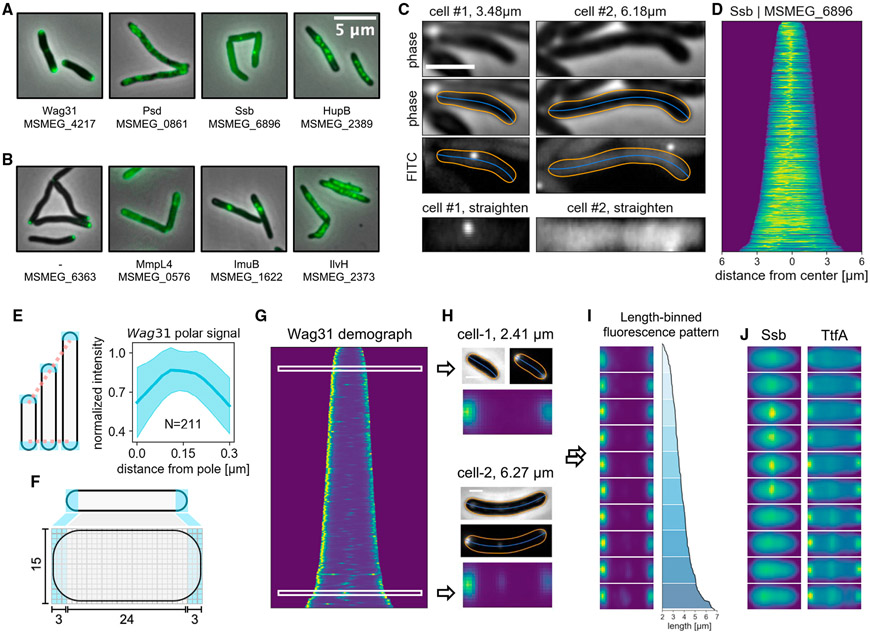
Figure 1. MOMIA enables streamlined image processing and renders a spatial-temporal representation of mycobacterial protein localization.
(A) Examples of MSR-Dendra strains with previously established subcellular localization patterns. Gene name and/or gene locus index is listed beneath each depiction.
(B) Example images of previously uncharacterized proteins in the MSR-Dendra library.
(C) MOMIA computes the morphological contours (orange lines) and centerlines (blue lines) with subpixel precision (STAR Methods). Here the representative cells express a single-stranded binding protein, Ssb-Dendra. Cellular fluorescence profiles are straightened and illustrated in bottom panels.
(D) Axial intensity profiles of Ssb-Dendra-expressing cells are normalized and stacked according to cell length to render the demograph.
(E) The expanse of the mycobacterial cell pole remains constant as the cell elongates. Left panel: cartoon illustrating the elongation-invariance of polar hemispheres. Right panel: the longitudinal intensity profiles of the polar 0.3 μm of 211 cells are interpolated, normalized, and realigned to calculate the averaged distribution (blue line, shaded area denotes one standard deviation from the mean) of Wag31-Dendra near the poles.
(F) Schematic of pole-aware transformation of single-cell fluorescence data (STAR Methods).
(G and H) (G) The demograph representation of Wag31 protein localization. The phase contrast and the fluorescence data of two representative cells of different lengths are shown in (H), with their standardized data matrices depicted below.
(I) Length-binned stacks of transformed Wag31-Dendra data, the corresponding length profiles are plotted on the right.
(J) Length-binned transformations of Ssb and TtfA. Scale bars, 2 μm in (C) and 1 μm in (H).

