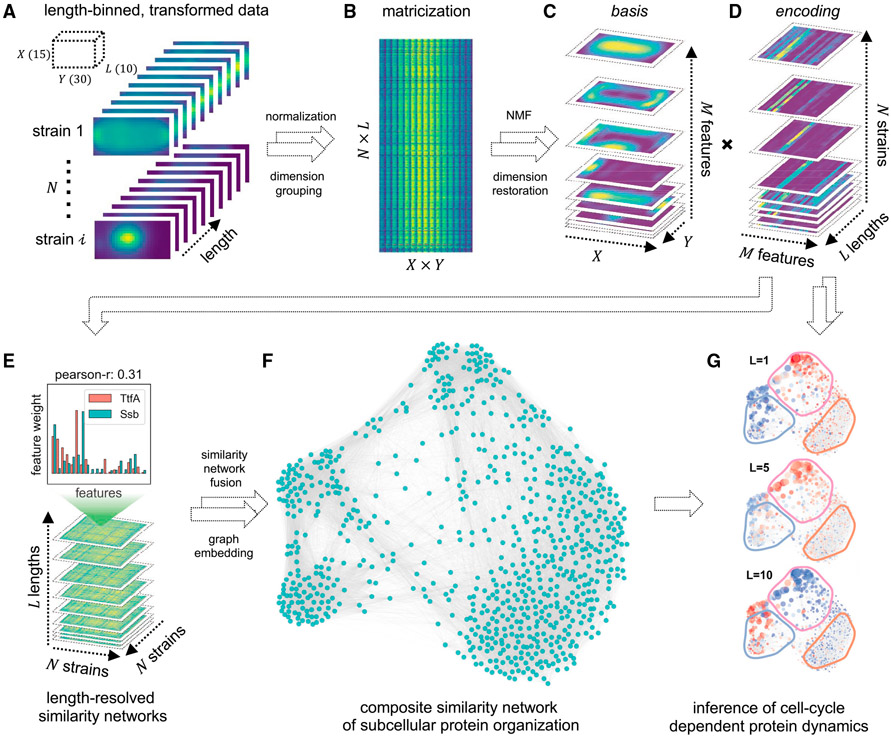
Figure 2. Schematic of GEMATRIA.
(A) Binning-transformed MSR-Dendra dataset comprising 760 MSR-Dendra entries and 17 spike-in validation entries. The length-binned data are normalized independently for each entry before compilation.
(B) Matricized form of the compiled MSR-Dendra dataset. The matrix comprises N × L rows, with each row being the flattened form (X × Y of a given length bin.
(C and D) Decomposition of the two-dimensional data from (B) using non-negative matrix factorization with M components (features). (C) The basis feature matrices are reformed to the shape of X × Y × M, with each one of the M slices being a two-dimensional depiction of the basis image. (D) The extracted encoding matrices are reformed to the shape of M × L × N. For each entry (strain), the input length-binned data are reduced to M feature profiles, with each profile being the length-resolved (L) feature weights.
(E) For each length bin (L in total), a pairwise similarity matrix (Pearson correlation coefficient) of the N entries is generated using feature weights from (D).
(F) Illustration of the composite network rendered by similarity network fusion.
(G) Illustration of color-coded length-resolved feature dynamics superimposed on the composite network (Video S4).

