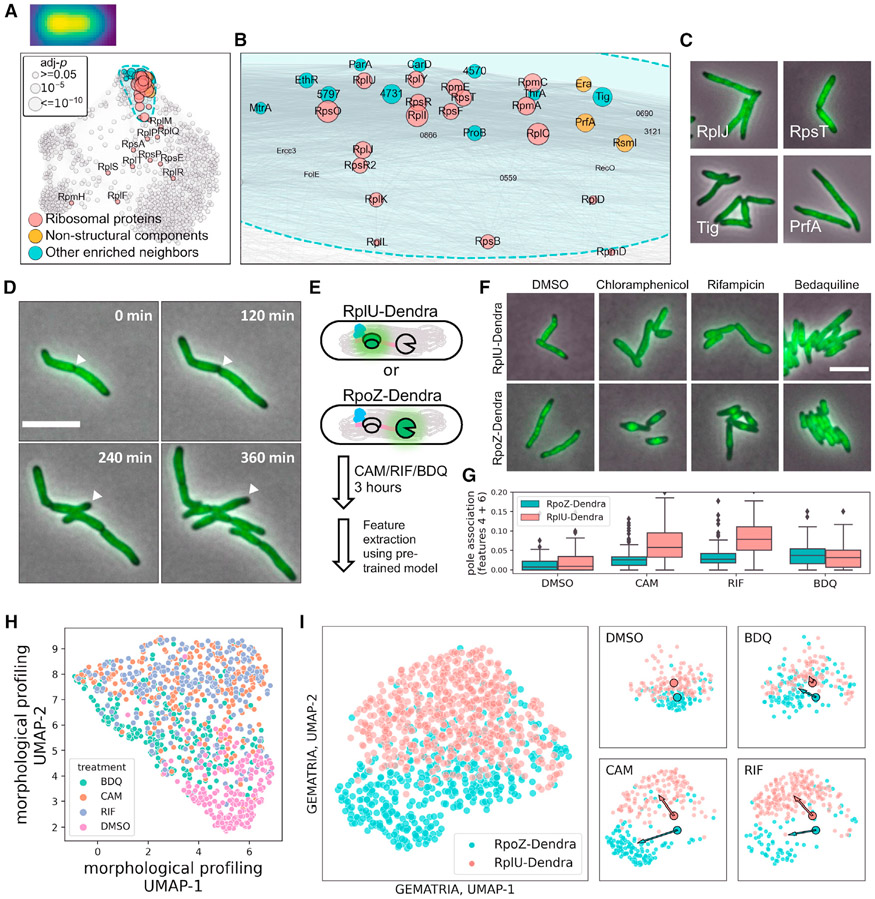
Figure 4. Mycobacterial ribosomes are excluded from the cell poles.
(A) SAFE revealed subdomains that are enriched for ribosomal proteins. The sizes of the nodes denote the FDR-corrected p values, as demonstrated in the top left panel. Ribosomal protein localization consensus is created as described in STAR Methods and depicted over the top left corner of (A).
(B) Zoom-in view of the ribosomal protein-enriched subdomain in (A).
(C) Example microscopy images of ribosomal proteins (top panels) and co-clustered neighbor entries (bottom panels).
(D) Representative slices of RplU (MSMEG_1364) time-lapse imaging data. The progression of ribosomes being excluded from a maturing new pole is highlighted by white arrowheads.
(E) Schematic of differential antibiotic treatments on cells expressing fluorescently marked ribosomes (RplU) or RNA polymerases (RpoZ).
(F) Representative images of RplU- or RpoZ-Dendra-expressing cells after 3 h exposure to 50 μg/mL chloramphenicol, 100 μg/mL rifampicin, 5 μg/mL bedaquiline, or 1:200× diluted DMSO.
(G) Rifampicin or chloramphenicol exposure caused polar repletion of diffused ribosomes as indicated by an elevated prevalence of features 4 and 6 (STAR Methods).
(H) Unsupervised two-dimensional Uniform Manifold Approximation and Projection (UMAP) representation of single-cell morpho-phenotypes upon differential antibiotic treatment.
(I) Two-dimensional UMAP representation of single-cell GEMATRIA feature profiles. The large scatterplot represents the allocation of antibiotic-treated single cells in UMAP space with individual cells color coded by their strain identities. UMAP projections of different treatment groups are plotted on the right. The two outlined dots represent the geometric centers of DMSO cells in UMAP space. The direction of antibiotic-induced changes in UMAP space is denoted by color-coded arrows pointing from the geometric centers of DMSO-treated cells to that of the antibiotic-treated cells.

