FIGURE 15:

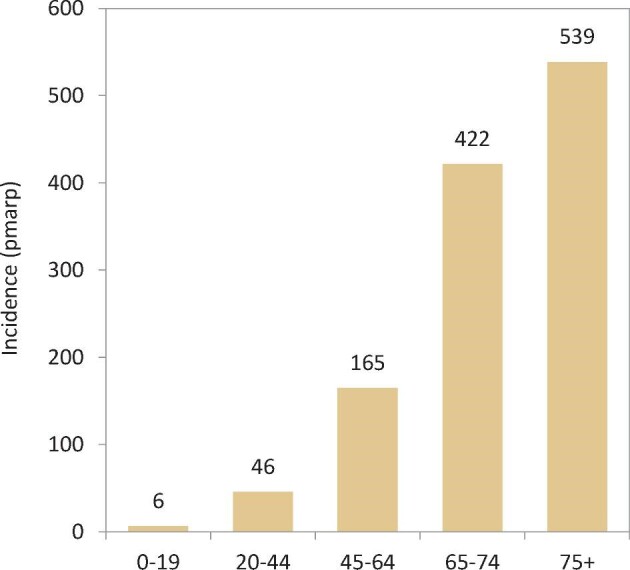
Incidence of RRT per million age-related population (p.m.a.r.p.) in 2019, on Day 1, by age, unadjusted. Results are based on data from registries providing individual patient data.

Incidence of RRT per million age-related population (p.m.a.r.p.) in 2019, on Day 1, by age, unadjusted. Results are based on data from registries providing individual patient data.