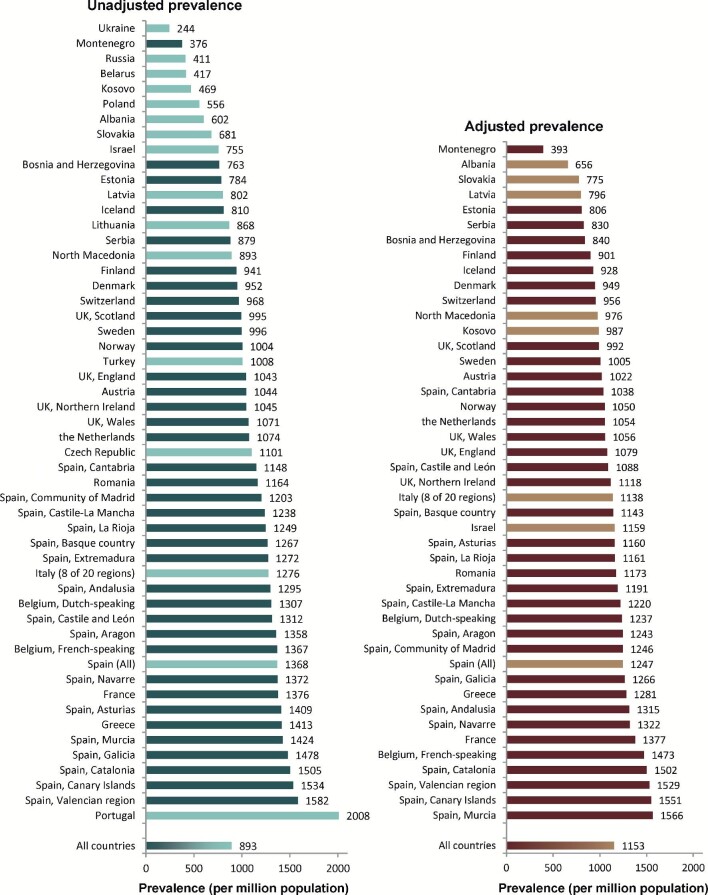
FIGURE 7:
Unadjusted (left panel) and adjusted (right panel) prevalence (p.m.p.) of RRT on 31 December 2019 by country or region. Registries providing individual patient data are shown as dark-coloured bars and registries providing aggregated data as light-coloured bars. Age- and sex-adjusted prevalence was calculated by standardization to the age and sex distribution of the EU-28 population. The prevalence for Israel, Poland and Slovakia only includes patients receiving dialysis.

