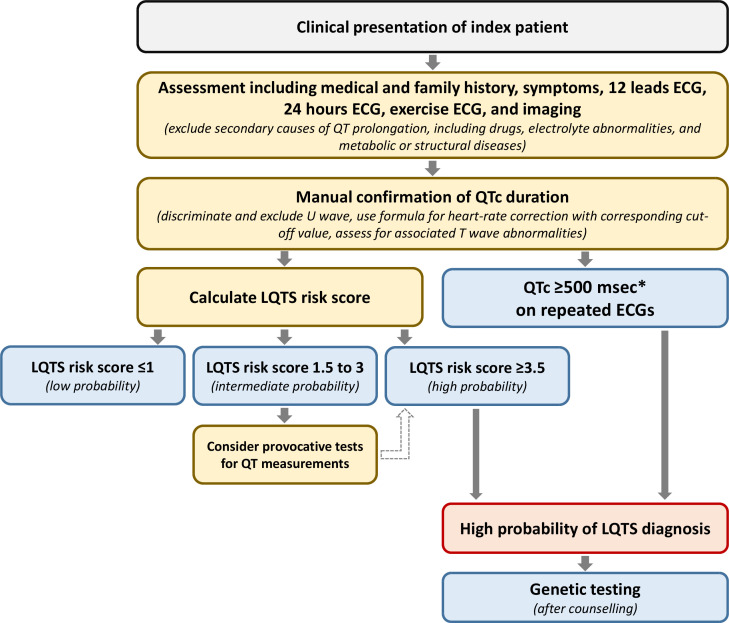
Figure 2.
Schematic flow chart for the diagnosis LQTS. Flow chart for the diagnosis of LQTS following the Heart Rhythm Society/European Heart Rhythm Association/Asian Pacific Heart Rhythm Society consensus document from 2013.3 The LQTS risk score (ie, the ‘Schwartz score’) is presented in figure 1. *QTc calculated by Bazett formula (QTc=QT/√RR). LQTS, long QT syndrome; QTc, corrected QT interval.

