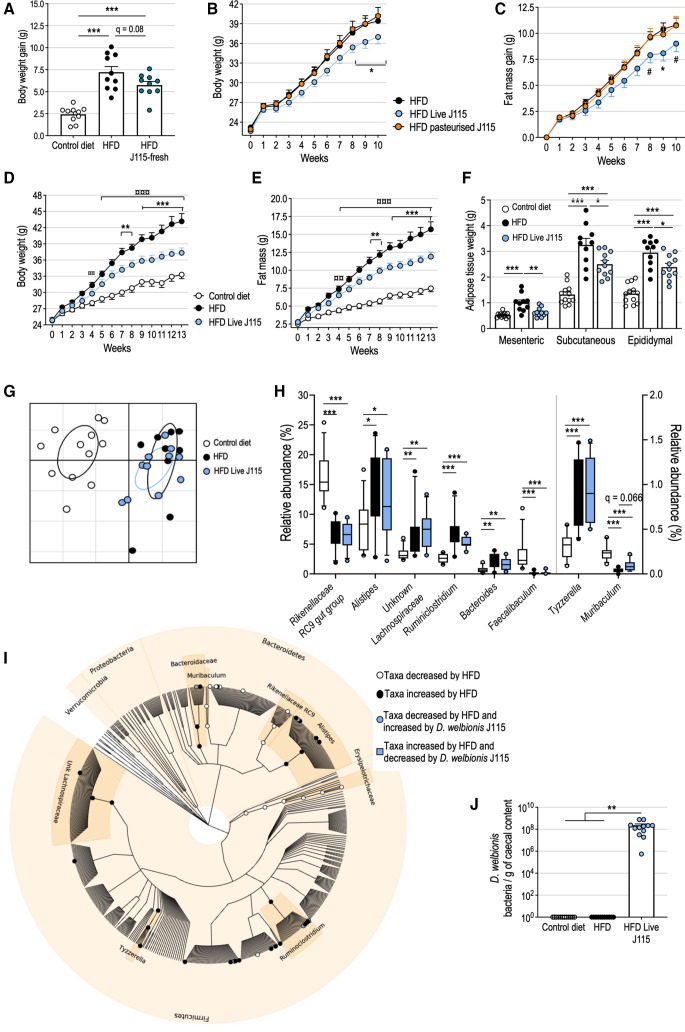
Figure 2.
Live Dysosmobacter welbionis J115T prevents diet-induced obesity in mice without major alterations of the faecal microbiota composition. (a) Body weight gain of mice fed a HFD and treated during 6 weeks by daily oral gavage with 1.0×10⁹ colony forming units (cfus) of freshly prepared D. welbionis J115T (HFD J115-fresh) and mice fed a control diet or a high-fat diet (HFD) and treated by daily oral gavage with vehicle. (B, C) Body weight and fat mass gain of mice treated during 10 weeks by daily oral gavage with live D. welbionis J115T frozen in trehalose (1.0×10⁹ cultivable, live bacteria per day and per mouse) and fed a HFD (HFD Live J115) or pasteurised D. welbionis J115T (HFD pasteurised J115) (1.0×10⁹ heat-killed bacteria per day and per mouse) and mice fed a HFD and treated by daily oral gavage with vehicle. (D, E) Body weight and fat mass of mice treated during 13 weeks by daily oral gavage live D. welbionis J115T frozen in trehalose (1.0×10⁹ cultivable, live bacteria per day and per mouse) and fed a HFD (HFD Live J115) and mice fed a control diet or a HFD and treated by daily oral gavage with vehicle. (F) Mesenteric, subcutaneous (inguinal) and epididymal fat pads weight at the end of the 13-week period. (G) Principal coordinates analysis of the microbiota composition of experiment 2. Mice microbiota were clustered and the centre of gravity computed for each group. (H) Relative abundance of the bacterial genera significantly altered by HFD or live D. welbionis J115T treatments. (I) Cladogram representing mice microbiota with white clade markers highlighting bacterial groups significantly more abundant in control mice than in HFD mice, black clade markers markers highlighting bacterial groups significantly more abundant in HFD mice than in control mice and light blue clade markers highlighting bacterial groups significantly increased (circle) or decreased (square) by live D. welbionis J115T administration in HFD-fed mice as assessed by figure part H. (J) Dysosmobacter spp concentration estimated by quantitative PCR in the caecal content of the mice. Number of mice per group: 10–12. Data were analysed using one-way analysis of variance (ANOVA) followed by Tukey’s post hoc test for figure parts A, F and J and two-way repeated measures ANOVA for figure parts B–E. Data were analysed using Kruskal–Wallis test followed by Dunn’s pairwise multiple comparison procedure for H–I. *q<0.05; **q<0.01; ***q<0.001. Results are represented as dot plots and bar plots with mean±SEM for figure parts A, F and J, and as boxes and whiskers (first quartile, median and third quartile) for figure part H. In figure parts B–E *q < 0.05; **q<0.01; ***q<0.001 for HFD versus HFD Live J115 comparisons and ¤¤¤q<0.001 for control versus HFD comparisons. In figure part C, #p=0.06. HFD, high-fat diet.

