Figure 5.
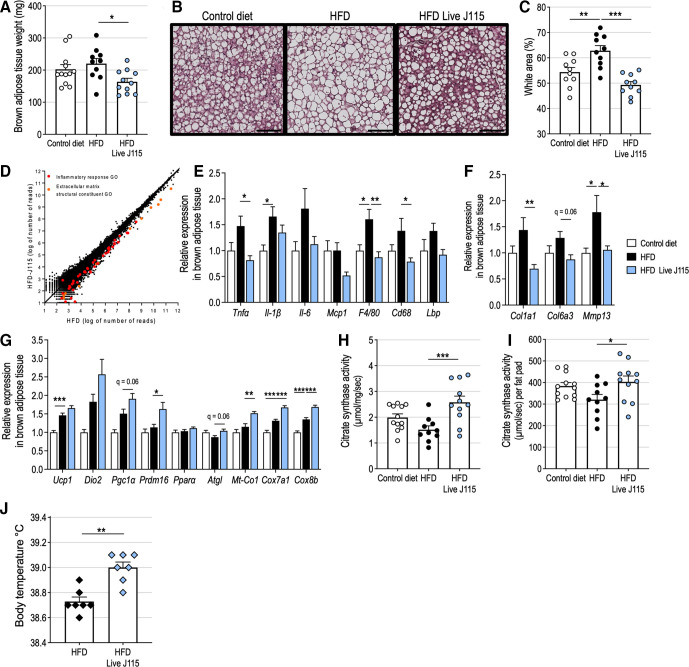
Live Dysosmobacter welbionis J115T reduces high fat diet (HFD)-induced brown adipose tissue (BAT) dysfunction and increases mitochondria number. (A) Interscapular BAT weight of mice treated by daily oral gavage with live D. welbionis J115T frozen in trehalose and fed an HFD (HFD Live J115) or mice fed a control diet or a HFD and treated by daily oral gavage with an equivalent volume of vehicle. (B) Representative H&E-stained pictures of BAT. Scale bar=100 µm. (C) Percentage of white area on the slices, corresponding to lipid droplets, in the BAT. (D) Scatter dot plot between RNA-seq expression data of a pool of RNA from the BAT of HFD mice and a pool of RNA from the BAT of HFD J115 mice. (E) Relative expression of genes related to inflammation and immune system in the BAT. (F) Relative expression of genes related to extracellular matrix and fibrosis in the BAT. (G) Relative expression of genes related to mitochondria number and function in the BAT. (H) citrate synthase activity per mg of BAT. (I) Citrate synthase activity per brown fat pad. (J) Body temperature of mice treated by daily oral gavage with live D. welbionis J115T and fed a high fat-diet (HFD Live J115) or mice fed a high-fat diet (HFD) and gavaged daily with vehicle for 3 weeks (experiment 4, see methods). Number of mice per group: 10–12 in figure parts A, C and E–I). Number of mice per group: 7 in figure part J. Results are represented as dot plots and bar plots with mean±SEM for figure part A, C and H–J and as bar plots with mean±SEM for figure parts E–G. Data were analysed using one-way analysis of variance followed by Tukey’s post hoc test for figure parts A, C and E–I and Mann-Whitney test for figure part J. *q<0.05; **p or q<0.01; ***q<0.001.HFD, high-fat diet.

