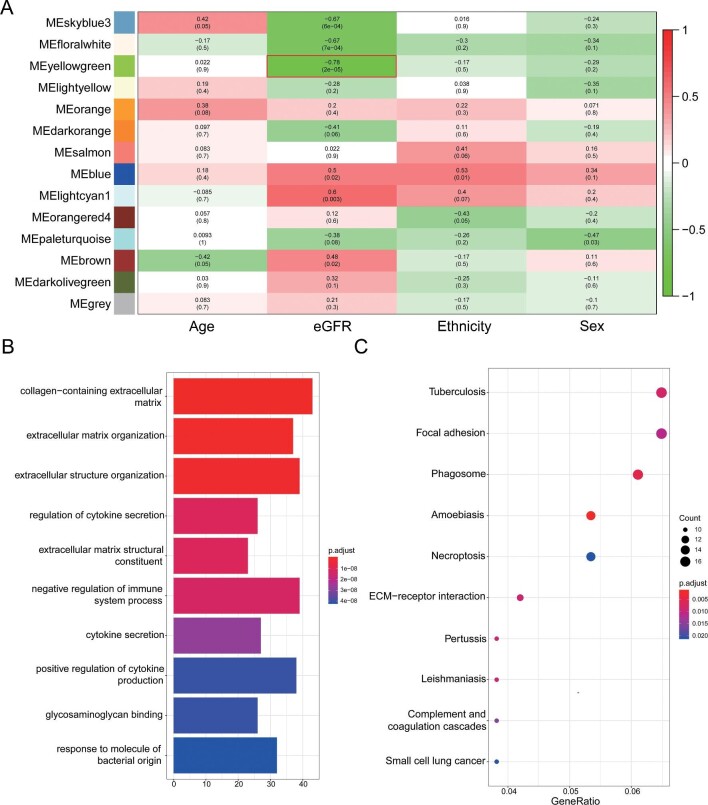
FIGURE 2:
Identification of gene modules negatively associated with eGFR in dataset GSE30529 and GO and KEGG pathway enrichment analysis. (A) Heatmap of the correlation between MEs and clinical characters in dataset GSE30529. The MEyellowgreen was the highest negatively correlated with eGFR. (B) The top 10 terms of GO analysis of all genes in the yellowgreen module identified by WGCNA. (C) The top 10 terms of KEGG pathway analysis of all genes in the yellowgreen module identified by WGCNA. GSE30529, dataset of microarray data of microdissected tubule samples from 10 patients with DN and 12 HC ME, module eigengene. Source: Woroniecka KI, Park AS, Mohtat D et al. Transcriptome analysis of human diabetic kidney disease. Diabetes 2011;60(9):2354–69; PMID: 21 752 957.

