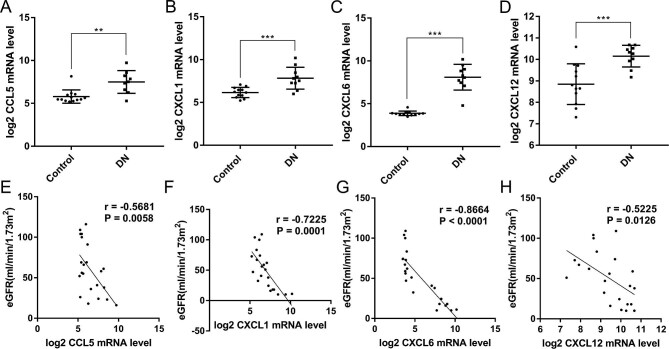
FIGURE 3:
Expression levels of candidate hub genes in DN biopsy tissues belonging to chemokines and their correlation with eGFR extracted from public datasets. (A) Expression level of CCL5 was elevated in DN glomeruli in dataset GSE30528. (B) Expression level of CXCL1 was elevated in DN tubules in dataset GSE30529. (C) Expression level of CXCL6 was elevated in DN tubules in dataset GSE30529. (D) Expression level of CXCL12 was elevated in DN tubules in dataset GSE30529. (E) Expression level of CCL5 was negatively correlated with eGFR in DN glomeruli in dataset GSE30528 (r = −0.5681, P = 0.0058). (F) Expression level of CXCL1 was negatively correlated with eGFR in DN tubules in dataset GSE30529 (r =–0.7225, P = 0.0001). (G) Expression level of CXCL6 was negatively correlated with eGFR in DN tubules in dataset GSE30529 (r = −0.8664, P < 0.0001). (H) Expression level of CXCL12 was negatively correlated with eGFR in DN tubules in dataset GSE30529 (r = −0.5225, P = 0.0126). * P < 0.05, ** P < 0.01, *** P < 0.001. Control, healthy controls. GSE30528, dataset of microarray data of microdissected glomeruli samples from 9 patients with DN and 13 HCs. GSE30529, dataset of microarray data of microdissected tubule samples from 10 patients with DN and 12 HCs. Source: Woroniecka KI, Park AS, Mohtat D et al. Transcriptome analysis of human diabetic kidney disease. Diabetes 2011;60(9):2354–69; PMID: 21 752 957.

