Abstract
This study cross-compares ICON/MIGHTI and Thermosphere, Ionosphere, Mesosphere Energetics & Dynamics (TIMED)/TIMED Doppler Interferometer (TIDI) MLT region neutral winds from middle Northern Hemisphere to low Southern Hemisphere latitudes. We utilized MIGHTI level-2.2 (v4) and TIDI level-3 (v11) neutral winds from January 2020 to November 2020 and found their conjunctions using a space-time window of LST ± 15 min, latitude ± 4°, and longitude ± 4° around each TIDI wind measurement. Due to the nature of their orbital geometry, frequent conjunctions occurred between MIGHTI and TIDI. These conjunctions are spread in longitudes and they occur at approximately fixed LSTs and latitudes, which allows us to compare their observed diurnal variability. MIGHTI and TIDI wind observations agree well (except on the TIDI coldside during forward flight) and show similar large amplitude longitudinal variations that can reach more than 100 m/s. MIGHTI and TIDI zonal and meridional winds show moderate correlations of 0.60 and 0.55, respectively. The slopes of regression fits for zonal and meridional winds are 0.92 and 0.91, respectively. The root mean square differences in zonal and meridional winds are 56 and 66 m/s, respectively. We found that TIDI coldside measurements in forward flight show a systematic bias and this behavior is repetitive as the instrument pointing direction is changed by the periodic TIMED yaw maneuver. The nature of this systematic bias suggests that the TIDI zero-wind references (at least for the coldside telescopes) need revision. This investigation can provide guidance toward improving the TIDI data analysis. In addition, the results of this study act as a validation of MIGHTI MLT winds.
1. Introduction
The Earth's upper atmosphere is a dynamic environment and neutral winds are a critical component of it. Neutral winds control a large part of the dynamics within the coupled upper atmosphere and ionosphere system and thus plays an important role in determining the state of the ionosphere-thermosphere (I-T) system at all latitudes. Due to the geometry of the Earth's geomagnetic field, neutral winds at lower latitudes can generate electric fields via the dynamo effect and push the ionospheric plasma upward and downward along the magnetic field lines (e.g., Immel et al., 2021; Kelly, 1989; Rishbeth, 1972). At high latitudes, they feed back into the ionospheric convection and can transport energy and momentum from high to low latitudes (e.g., Dhadly & Conde, 2017; Killeen, 1987; Killeen & Roble, 1986; Richmond et al., 2003; Wang et al., 2021). In the mesosphere and lower thermosphere (MLT, 60–110 km), where most tides and waves dissipate, neutral winds control the energy and momentum entering the upper atmosphere via gravity waves, tides, and planetary waves from the underlying regions (including the troposphere, stratosphere, and lower mesosphere; e.g., Forbes, 2007; Forbes et al., 2006; Lindzen, 1981; Smith, 1996, 2004; Yiğit et al., 2016). The changes in tidal dissipation and gravity wave breaking/filtering by neutral winds can lead to changes in the whole atmosphere circulation (e.g., England, 2012; Smith, 2004). Therefore, accurate global monitoring of upper thermospheric, as well as MLT region neutral winds is crucial for advancing global I-T space weather research and forecasting capabilities. Despite the known importance of neutral winds and their role in I-T electrodynamics, the global coverage and monitoring of neutral winds has remained one of the most undersampled state parameters in the Earth's upper atmosphere (e.g., Drob et al., 2015; Dhadly, Emmert, Drob, Conde, et al., 2018; Dhadly et al., 2017; Emmert et al., 2008; Heelis & Maute, 2020; Meriwether, 2006). In addition, relatively few wind monitoring missions have been conducted in past decades. Given our ever-increasing reliance on space-based technology, and recognizing the control of neutral winds on upper atmospheric and ionospheric dynamics and electrodynamics, the accurate knowledge of the neutral wind system is crucial for humanity's emerging space needs.
Various space-based missions using different wind measuring techniques have been launched in the past. Although some of them co-existed for short periods of time, they never presented an opportunity to cross-compare/calibrate with each other. Dynamic Explorer 2 (DE2), launched in 1981, was the first to monitor upper thermospheric neutral winds from space using optical Doppler spectroscopy using a Fabry-Perot interferometer (FPI; e.g., Hays et al., 1981; Killeen & Roble, 1988; Spencer et al., 1981). WINDII (Wind Imaging Interferometer—based on Michelson Interferometer) for lower and upper thermospheric winds and HRDI (High-Resolution Doppler Imager—based on FPI) for MLT and below, were launched on UARS (Upper Atmosphere Research Satellite) in 1991 and stayed operational until 2005 (e.g., Shepherd et al., 1993, 2012). Thermosphere, Ionosphere, Mesosphere Energetics and Dynamics/TIMED Doppler Interferometer (TIMED/TIDI) primarily focused on monitoring MLT winds was launched in 2001, but did not reach optimum performance at least until 2005 (e.g., Killeen et al., 1999; Niciejewski et al., 2006). GOCE and CHAMP measured in situ cross-track upper thermospheric winds using onboard accelerometers with life spans from 2000 to 2010 and 2009 to 2013, respectively (e.g., Doornbos et al., 2010; Förster et al., 2008). GOCE and CHAMP wind measurements overlapped between 2009 and 2010, but the differences in their orbital geometries and measurements of only one wind component (cross-track) made any cross-comparison between them extremely challenging. Thus, even though some overlap between these past missions existed, none of them presented good opportunities for in-space cross-comparison/calibration. Their wind observations (mostly upper thermospheric) have been cross-validated in the past, mostly using ground-based wind measurements—climatologically as well as using conjunctions (e.g., Aruliah et al., 2019; Dhadly, Emmert, Drob, Conde, et al., 2018; Dhadly et al., 2017, 2019; Duboin, 1997; Gault et al., 1996; Killeen et al., 1984). However, large-scale neutral wind cross-validation studies are extremely rare due to the lack of continuous and simultaneous vector wind measurements.
Out of these space-based missions, TIMED/TIDI is still monitoring MLT winds after ~20 yr in orbit. TIDI was launched in 2001 into a ~74° inclination orbit at 625 km altitude to investigate the dynamics and energetics of the Earth's MLT region (Killeen et al., 1999; Niciejewski et al., 2006; Yee et al., 1999). TIDI has produced the most extensive global MLT neutral wind archive ever collected by the aeronomy community. Recently, a new space-based sensor—MIGHTI (Michelson Interferometer for Global High-resolution Thermospheric Imaging) on board ICON (Ionospheric Connection Explorer)—was launched in 2019 into a 27° inclination orbit at ~575 km altitude to observe lower and upper thermospheric neutral wind simultaneously (Englert et al., 2015, 2017). Because TIDI is in high and MIGHTI is in a low inclination orbit, frequent conjunctions spread over wide geographic regions are occurring between them (see details in Section 3). In addition, both of them provide fully resolved MLT region horizontal wind vector observations. The frequent conjunctions and fully resolved horizontal winds provide us an unprecedented opportunity to perform a large-scale cross-calibration study of MLT neutral winds from two independent space-based optical sensors. Such frequent conjunctions are hard to achieve between a space-based and ground-based stations, unless a special orbit is selected that would limit its geospatial coverage. Because of the large geospatial and temporal spread of conjunctions between MIGHTI and TIDI, this study serves as a large-scale cross-validation of ICON/MIGHTI and TIMED/TIDI. TIDI local solar time (LST) coverage does not vary much each day and conjunctions are spread in longitude (see Section 3). Thus, this study, for the first time, allows us to compare longitudinal variability at a fixed latitude and LST from two independent platforms. Migrating tides are responsible for creating strong day-night variations in the upper atmosphere, whereas nonmigrating tides create longitudinal variations at a fixed local time. Thus, the longitudinal organization of the MLT at fixed LST is preferentially controlled by nonmigrating tides (e.g., Oberheide et al., 2006). Forcing due to zonally asymmetric latent heat release by deep tropical convective cells is considered the major source of non-migrating tides (e.g., Hagan et al., 2007, 2009). The longitudinal signatures of nonmigrating tides can only be detected with distributed networks of ground-based observations or spacecraft (e.g., England, 2012). MIGHTI and TIDI are well suited for these kinds of observations. Because of the MIGHTI and TIDI conjunction geometry, this study provides the first validation of the longitudinal fluctuations that TIDI has been seeing for the past two decades.
MIGHTI upper thermospheric (~240 km) and MLT winds (between 94 and 104 km) have been validated recently by Makela et al. (2021) and Harding et al. (2021), respectively. Makela et al. (2021) used two ground-based FPIs and Harding et al. (2021) used four ground-based meteor radars in the validation process. However, the latitudinal and longitudinal geographic coverage of winds has remained scarce due to an uneven distribution of suitable ground-based instruments. Here, we investigate the large-scale cross-validation of ICON/MIGHTI and TIMED/TIDI MLT horizonal neutral winds from low southern hemisphere (~15°S) to middle Northern Hemisphere latitudes (~42°N).
This study is organized as follows. Section 2 discusses the details of instruments and their neutral wind measurements. Section 3 describes the data used, the details of the criteria used for finding conjunctions between MIGHTI and TIDI, and the methodology for inter-comparison. Section 4 presents the results of the inter-comparisons. Finally, the major findings are summarized in Section 5.
2. Instrumentation
2.1. ICON/MIGHTI
MIGHTI uses the Doppler Asymmetric Spatial Heterodyne (DASH) technique (Englert et al., 2007) for remote sensing of the lower and upper thermospheric neutral winds between the altitudes of 90 and 300 km. It is similar to the Michelson Interferometers used on WINDII, but MIGHTI has no moving interferometer parts and interferogram samples are recorded simultaneously for different emission lines (Englert et al., 2015, 2017). MIGHTI records interferometric limb images of the naturally occurring thermospheric green line (557.7 nm) and red line (630.0 nm) atomic oxygen emissions. Using these images, altitude profiles of LOS winds are retrieved from the observed Doppler shift. During daytime, MIGHTI measures wind profiles continuously between 90 and 300 km, using green line data between 90 and 190 km and red line data between 180 and 300 km. However, at nighttime, green line emissions stay confined to the lower thermosphere and red line emissions are confined to the upper thermosphere. Thus, at nighttime, MIGHTI wind profiles are observed using the green line between 90 and 109 km and the red line between 210 and 300 km, leaving a gap between 109 and 210 km (Englert et al., 2017; Harding et al., 2021).
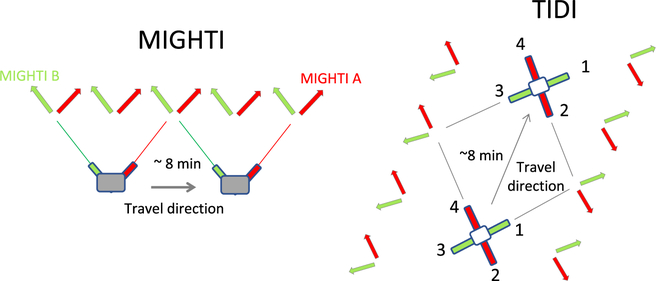
MIGHTI employs two separate DASH interferometers (MIGHTI A and MIGHTI B) aligned orthogonal to each other (refer to Figure 1). Currently they are both north-viewing and pointed 45 and 135 in azimuth from the spacecraft velocity direction. In this northward limb viewing geometry, they cover latitudes from ~12S to 42N. MIGHTI daytime and nighttime single exposure times are 30 and 60 s, respectively, which corresponds to 250–500 km along the satellite track (Englert et al., 2017; Wu et al., 2020). MIGHTI B observes virtually the same atmospheric tangent point regions as MIGHTI A, parallel to the satellite track and within about 8 min. The orthogonality between MIGHTI A and B sensors allows to them to construct a full horizontal wind vector from the LOS winds retrieved from each sensor, assuming neutral winds are constant over that time period. The details of MIGHTI A and B sensors are discussed by Englert et al. (2017), and their wind retrieval process is discussed by Harding et al. (2017). Although the sampling rate of each MIGHTI sensor is high, two LOS winds at a single common location are measured ~8 min apart. Thus, the estimated horizontal vector winds are analogous to high cadence data but susceptible to any temporal wind variations within the 8 min window. The vertical resolution of MIGHTI in the MLT is ~3 km. MIGHTI covers all LSTs for a given latitude in ~27 days (Immel et al., 2018).
Figure 1.
A graphic illustration of MIGHTI and TIDI viewing geometry.
For this comparison, we used the MIGHTI level 2.2 data product (v4) from January to November 2020. The accurate retrieval of winds from the observed Doppler spectrum depends on the zero-wind calibration (i.e., the determination of the interferogram signature expected for zero wind speed), because the error in the zero-wind leads to a bias in the retrieved winds. For MIGHTI version 4, level 2.2. wind data, the zero-wind is estimated by comparing a 60-day average of MIGHTI data with a 60-day average of the empirical wind climatology Horizontal Wind Model 2014 (HWM14—Drob et al., 2015). This approach constrains the average MIGHTI winds to the average HWM14 winds, but preserves any measured wind variations. A MIGHTI zero-wind determination that is independent of HWM14 is planned for implementation in version 5.
2.2. TIMED/TIDI
The TIMED TIDI instrument is a limb-scanning FPI. It has four vertically scanning orthogonally oriented telescopes in a cross-shaped pattern, 45° to the satellite velocity vector and observes the limb simultaneously at four orthogonal directions (refer to Figure 1). This configuration is similar to the MIGHTI, but MIGHTI has only two viewing directions. TIDI telescopes make two orthogonal observations of the same tangent location from two satellite orbital positions, each ~8 min apart as the satellite moves forward. The two observations are paired and decomposed into the meridional and zonal wind components. Because of four viewing directions, winds are measured at two different LSTs from each spacecraft location. Four orthogonal telescopes, two on either side of the TIMED orbital path, view the limb simultaneously in two narrow swaths separated by ~3,300 km (corresponding to ~30° longitude) at low latitudes (Niciejewski et al., 2006).
The TIDI telescopes facing the sun-ward side are referred to as “warmside” and the ones facing away from the sun are referred to as “coldside” telescopes. The TIMED satellite performs one 180° yaw maneuver roughly every 60 days to ensure that the warm and cold sides of the satellite are always pointing toward and away from the sun, respectively. That is, the warmside telescopes always remain on the sunward side and coldside telescopes remain on the shadow side. TIDI measures MLT region winds between 70 and 120 km at daytime and 80 and 105 km at nighttime using O2 (0,0) atmospheric band lines. The precession rate of the TIDI satellite is about 12 min per day, so that the full LST coverage is achieved every 60 days. The TIDI orbit is such that it returns to almost the same LST and latitude coordinates it viewed exactly 1 yr earlier (Niciejewski et al., 2006).
Right after the launch in 2001, the throughput of TIDI rapidly decreased due to the formation of frost on the detector windows. However, two roll maneuvers were performed in 2003 to melt the frost; they helped with the sublimation of a large fraction of frost and throughput continued to increase before stabilizing around 2005. The TIDI and throughput restoring details are discussed in Killeen et al. (2006) and Niciejewski et al. (2006)
It is important to note that there are two versions of TIDI MLT winds processed independently by two institutions—University of Michigan (UMich) and National Center for Atmospheric Research (NCAR). This study utilizes UMich TIDI level 3 (v11) of vector winds. The zero-reference wind for UMich TIDI consists of a 4 × 2 array corresponding to each of the four individual telescope views, one set for forward flight and the second for backward flight. The backward and forward flight represent the pointing directions. This was necessary to accommodate the change of view directions following each yaw maneuver cycle. The zero-wind baseline for UMich TIDI data were calculated using three parameters: the spacecraft velocity, the Earth rotation velocity, and a reference velocity. The reference velocity has a slow time dependence, and is different (or set to zero) for each of the telescopes. TIDI zero-wind baselines were calculated after the launch of TIDI when it was recovering from the frost deposition on the optics; the winds are estimated assuming that the earlier baselines for each telescope are still valid. The TIDI zero-wind baseline calculation details are discussed in Killeen et al. (2006). The NCAR TIDI dataset and analysis details will be discussed in a follow-on study.
3. Data and Conjunction Selection Criteria
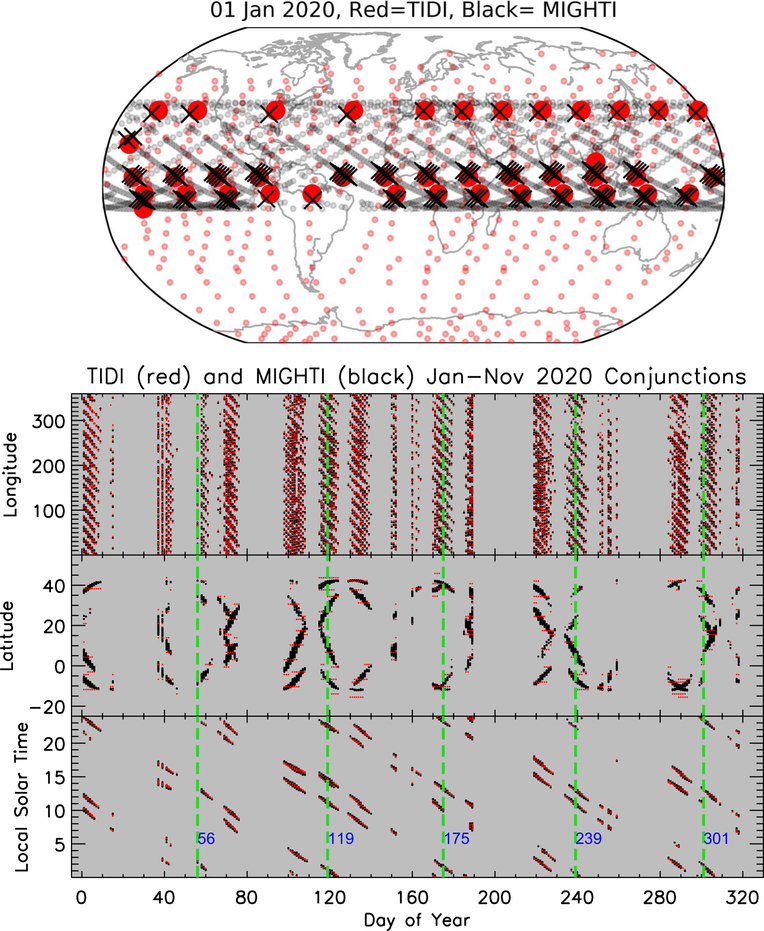
This study includes MIGHTI data from January to November 2020. For finding coincident wind measurements (or conjunctions) between MIGHTI and TIDI, we used a space-time window of LST±15 min, latitude±4°, and longitude±4° around each TIDI wind measurement. Any MIGHTI data within this TIDI space-time window was considered a conjunction. Figure 2 illustrates the conjunction locations as well as the all wind measurement locations as a function of latitude and longitude from MIGHTI and TIDI on 01 January 2020. Also shown are the conjunctions as a function of longitude, latitude, LST, and day of year 2020. The space-time conjunctions between TIDI and MIGHTI are spread in longitudes around fixed latitudes and LSTs each day (because TIDI LST coverage varies only by 12 min per day). Due to high spatiotemporal resolution of MIGHTI and TIDI data, sometimes multiple TIDI and MIGHTI measurements fall within each space time conjunction window (as shown in the 01 January example—top panel). Thus, multiple MIGHTI/TIDI data points exist at a single conjunction. To simplify the comparisons, we have binned and averaged the TIDI and MIGHTI winds at each conjunction into 0.5 UT wide, 10° wide latitude, and 5 km wide altitude bins for each day.
Figure 2.
Top panel shows mapped MIGHTI and TIDI measurement conjunction locations on January 1, 2020. The conjunction locations are marked with large symbols (black crosses for MIGHTI and red dots for TIDI), while the small symbols show all the MIGHTI and TIDI measurements locations January 1, 2020. The lower three panels show MIGHTI and TIDI measurement conjunctions between January and November 2020, as a function of longitude, latitude, local solar time, and day of year. The green vertical lines mark the days when TIDI make yaw maneuvers and blue numbers next to the green lines indicate their day number.
Both MIGHTI and TIDI measurements suffer from twilight contamination due to the limb sounding geometry. MIGHTI data quality is controlled by the “wind quality factor,” which can be used to select appropriate data. For TIDI, we exclude TIDI data when the solar beta angle (the angle between the orbital plane and the Earth-Sun vector) is greater than 55 (i.e., when TIDI observations are near the terminator). Refer to Figure S1 of Dhadly, Emmert, Drob, McCormack, and Niciejewski (2018) for the variation of solar beta angle as a function of day of year. This TIDI data elimination leaves a gap of roughly 3 weeks centered at the middle of February, April, August, and October each year.
For finding conjunctions, we only used samples for which the MIGHTI “wind quality factor” is greater or equal to 0.5 (i.e., moderate to highest quality). We have also tested our statistical results (discussed in Section 4) using only data with wind quality factor = 1, but did not see significant improvement in the overall results. We have removed the data points corresponding to the South Atlantic Anomaly (SAA) region from any statistical analyses in Section 4; however, we have kept them in individual day visualizations. Based on the above conjunction selection criteria (excluding SAA), a total of ~8,200 conjunctions (binned and averaged) occurred between 90 and 115 km from January to November 2020 covering various seasons, local time, latitudes, and longitudes. Individually, the number of data points at conjunctions before binning and averaging for MIGHTI and TIDI are ~62,000 and ~36,000 respectively.
In Figure 2, the green vertical lines mark the days when TIDI made yaw changes to keep the coldside telescopes facing away from the sun. There are six TIDI yaw cycles between January and November 2020, each covering ~60 days. TIDI yaw cycle 1 covered day 1–56, yaw cycle 2 covered 56–199, yaw cycle 3 covered 119–175, yaw cycle 4 covered 175–239, yaw cycle 5 covered 239–301, and so on. TIDI flew in backward configuration during the yaw cycles 1, 3, and 5 and in forward configuration during yaw cycles 2, 4, and 6. Some of the gaps in the conjunction plots are because of no overlapping MIGHTI and TIDI measurements. Others are due to the gaps in TIDI wind measurements when its solar beta angle is greater than 55 (in Section 3).
For reference, we have also included Horizontal Wind Model (HWM14—Drob et al., 2015) winds in this study. After finding the conjunctions between MIGHTI and TIDI, we calculated HWM14 winds at MIGHTI and TIDI conjunction locations and processed HWM14 winds in the same manner as discussed above for MIGHTI and TIDI.
4. Results and Discussion
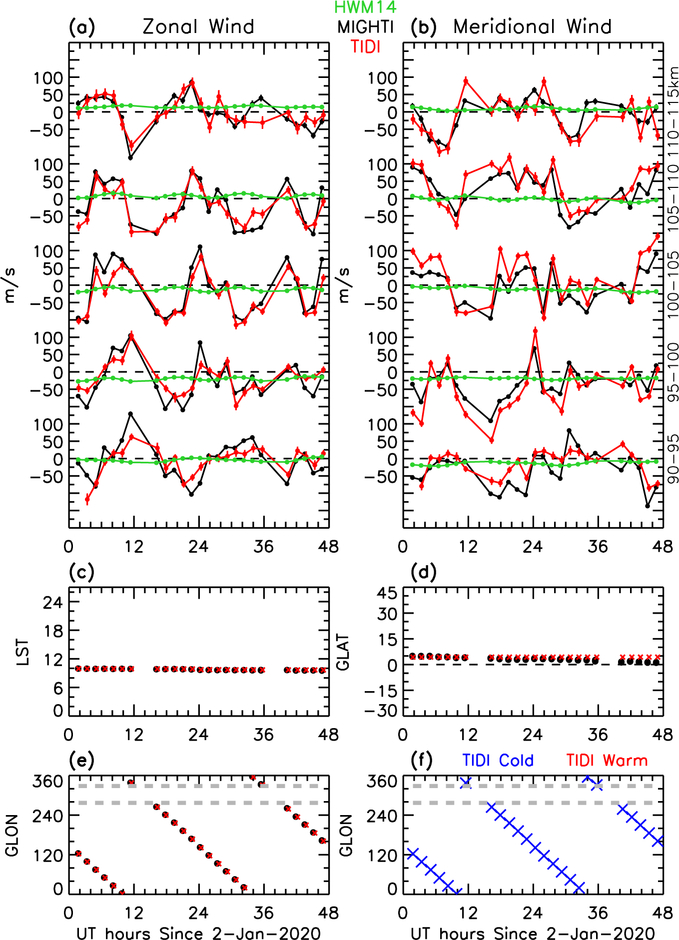
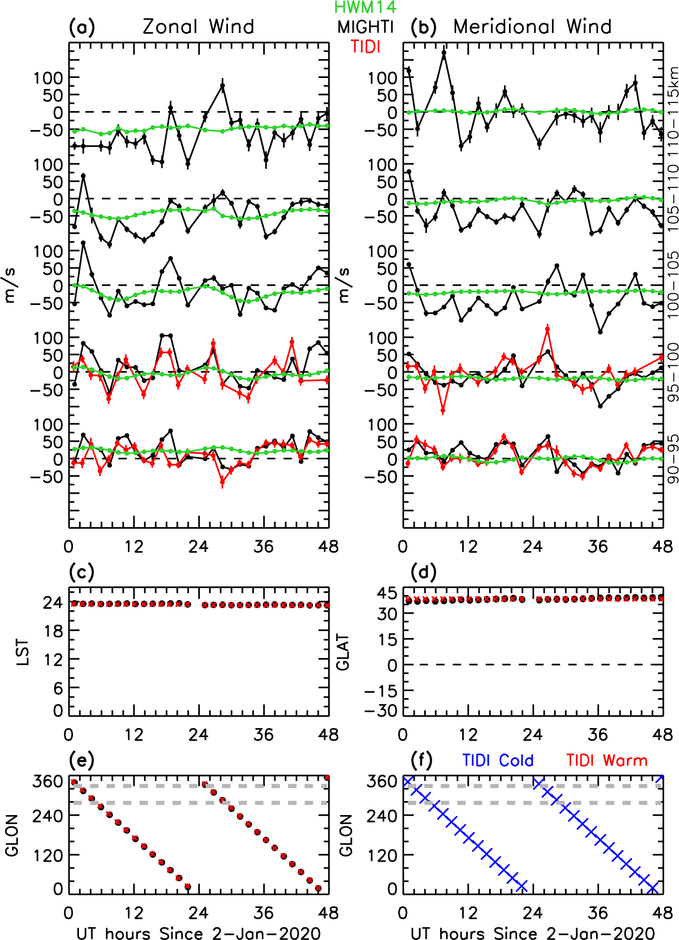
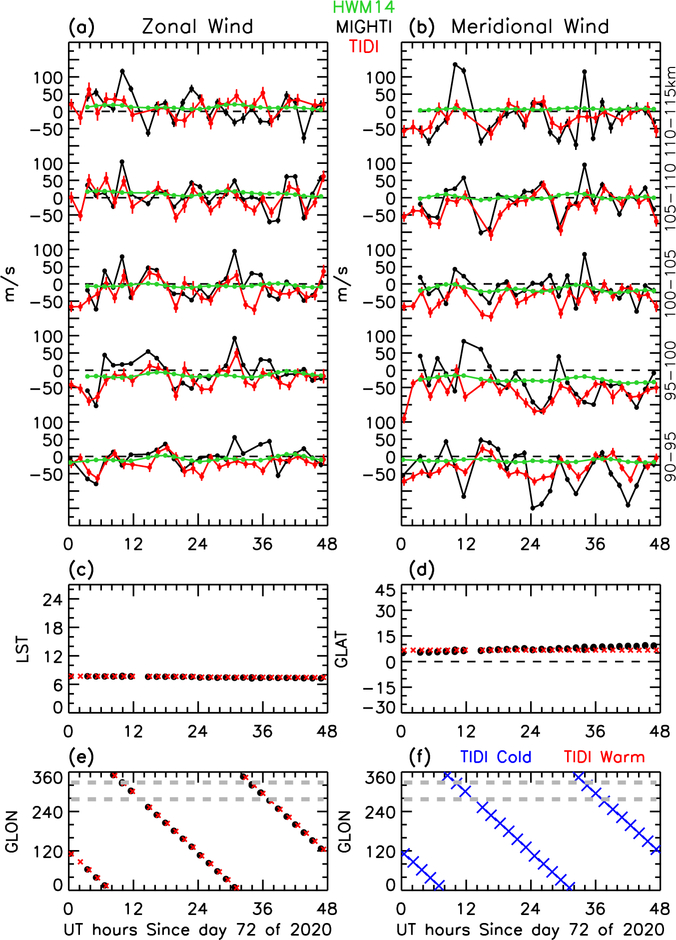
Figures 3 and 4; Figure S1 in Supporting Information S1 show MIGHTI and TIDI horizonal wind components (zonal and meridional) at conjunctions on January 2 and 3 as a function of universal time (UT) and altitude. The variation in LST, geographic latitude, and geographic longitude with UT is also shown for reference. The last panel (panel f) in each of these figures displays information on the TIDI telescope directions (coldside or warm-side). On these days, the MIGHTI and TIDI conjunctions occurred at daytime as well as nighttime (as shown in the LST subpanel). The daytime conjunctions occurred both on the warmside and the coldside of TIDI, while the nighttime conjunctions occurred only on the coldside (as shown in the last subpanel of each figure). Daytime conjunctions (warm and coldside—Figure 3 and Figure S1 in Supporting Information S1) occurred around equatorial and low southern latitudes. Nighttime conjunctions (coldside) occurred only at middle latitudes (Figure 4). The TIDI nighttime data is shown only for altitudes below 100 km because at nighttime its altitude coverage is limited as discussed in the instrumentation section. HWM14 winds are included for reference. As illustrated in these figures, MIGHTI and TIDI conjunctions are almost locked in LST and latitude. Thus, there is no cross-contamination by LST or latitude in the depicted winds; it allows a time-dependent comparison between MIGHTI and TIDI. In other words, these figures show the longitudinal variation of winds at a fixed LST. The longitudes between the two gray horizontal dashed lines (panel f) corresponds to the SAA. SAA data were included only to avoid any unnecessary gaps/breaks in the graphical representation. In the SAA region, the contaminated wind measurements from MIGHTI and TIDI sometimes are different as the two instruments react differently in this region to the enhanced flux of energetic particle precipitation.
Figure 3.
Comparisons between MIGHTI (black) and TIDI (red) wind components (zonal in panel (a) and meridional in panel (b)) for days 2 and 3 of 2020. The comparisons are shown as a function of UT at various 5 km wide altitude bins (shown on the right in the panel (b)). HWM14 winds (green) are also shown for reference. The variation in local solar time (LST), geographic latitude (GLAT), and geographic longitude (GLON) with universal time (UT) are shown in panels (c), (d), and (e), respectively. The panel (f) indicate which TIDI telescopes (warmside or coldside) measured the shown winds in panels (a) and (b). These measurements are from dayside equatorial latitudes and from TIDI coldside telescopes. The longitudes between two gray horizontal dashed lines (in panels (e) and (f)) corresponds to the SAA.
Figure 4.
Same as Figure 3, but at nighttime and middle latitude.
As shown in these figures, MIGHTI and TIDI wind observations agree well with each other overall, and show similar large amplitude longitudinal variations in MLT winds that match in amplitude and phase. These longitudinal fluctuations can reach more than 100 m/s. In both data sets, with increasing altitude, the overall shape of longitudinal variation is retained, but it shows phase progression; this is a signature of upward propagating tidal/wave activity in winds. Because these longitudinal fluctuations are at fixed LST, they are most likely the signatures of non-migrating tides or stationary planetary waves in MLT winds (e.g., England, 2012; Oberheide et al., 2006). It is interesting to note that HWM14, which is based on empirical climatology of decades of previous wind measurements, shows almost non-existent longitudinal variation in winds with a mean around 0 m/s. This is because HWM14 does not fit nonmigrating tides. The absence of these large amplitude longitudinal fluctuations in HWM14 is thus consistent with a non-migrating tidal source of the longitudinal variations seen in MIGHTI and TIDI.
The root mean square difference (RMSD) between MIGHTI and TIDI on dayside/nightside for zonal and meridional winds are 30–34 and 38–29 m/s, respectively. It must be noted that MIGHTI and TIDI measurements are not expected to precisely agree because MIGHTI and TIDI conjunctions are generally not at exactly at the same time and location, as described above and the instruments are integrating along different viewing geometries and some of the scatter in their measurements can be attributed to the different gradients in the parameters along those viewing geometries. However, we deem the agreement between TIDI and MIGHTI estimated winds to be more than satisfactory. Figures S2 and S3 in Supporting Information S1 illustrate a similar example but from day 37 to 38.
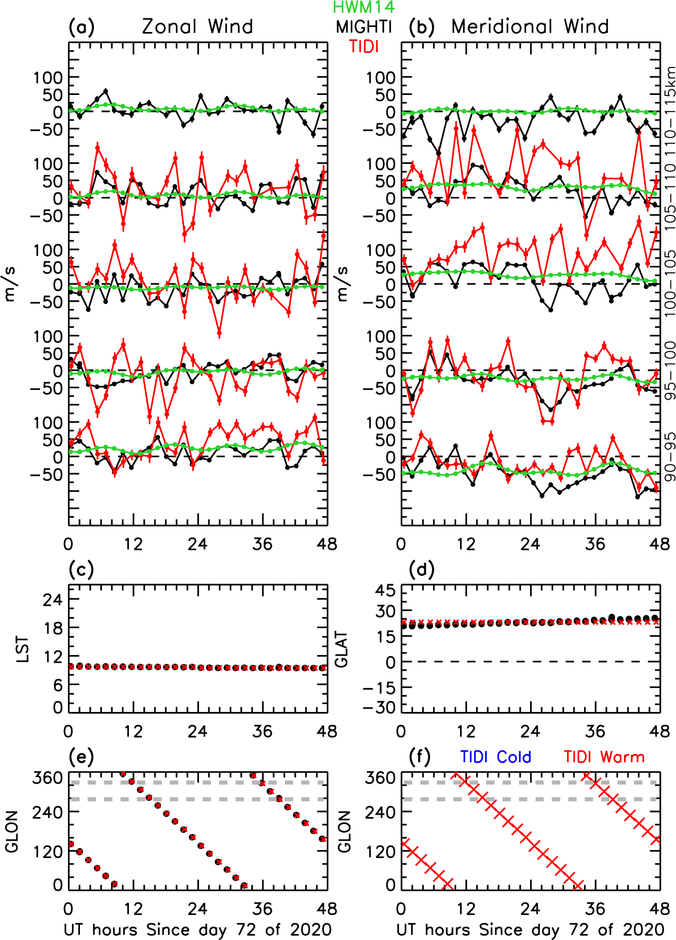
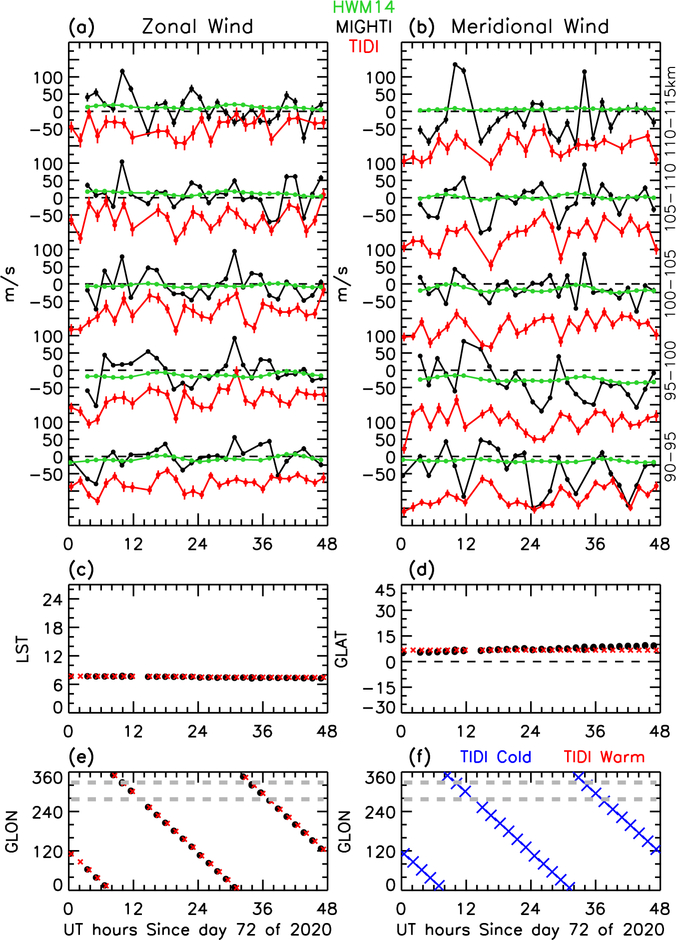
The figures discussed above are cases with good agreement. However, we found that MIGHTI and TIDI winds do not always agree. For example, Figures 5 and 6 illustrate comparisons from days 72–73. On these days, MIGHTI and TIDI conjunctions occurred mostly on the dayside at lower (~5°–10°) and lower-middle (20°–25°) latitudes (as shown in latitude variation panels). Figure 5 shows TIDI warmside conjunctions and Figure 6 shows TIDI coldside conjunctions. On these days, the variance of the TIDI warmside winds is more than double that of MIGHTI. Nevertheless, TIDI wind variations appear to be in phase without any systematic bias. However, on the TIDI coldside, there is a systematic difference between MIGHTI and TIDI winds. TIDI mean zonal and meridional winds are 71 m/s more westward and 96 m/s more southward than MIGHTI. The bias between TIDI MIGHTI appears consistent at all the altitudes shown. The interesting feature of the TIDI and MIGHTI wind time series is that their wind fluctuations are in phase (vary together) with each other. Figures S4 and S5 in Supporting Information S1 show a similar example, but on a different day. The systematic difference between MIGHTI and TIDI wind, the wind bias, appears to be additive, given that the direction of the bias is the same whether the wind component is positive or negative. The additive nature of the bias and similarly varying MIGHTI and TIDI wind fluctuations at all altitudes suggests that the bias originates in the zero-wind calibration of one of the instruments (MIGHTI or TIDI). MIGHTI winds follows HWM14 baseline which is not surprising because MIGHTI zero-wind baseline is based on HWM14 winds.
Figure 5.
Same as Figure 3, but showing MIGHTI and TIDI wind comparisons at their conjunctions on days 72 and 73 days of 2020. TIDI measurements are from warmside. Days 72 and 73 are in TIDI yaw cycle 2 (days 56–119).
Figure 6.
Same as Figure 5, but comparison are shown for lower latitude and different LST. TIDI measurements are from coldside telescopes.
The nature of the bias between TIDI and MIGHTI suggests that TIDI zero-wind baselines may no longer be valid. The TIDI zero-wind baselines were calculated after the launch and have not been revised after. They contain a slow time-dependent component which was necessary at the start of the mission. At the beginning of the TIDI mission, the overall throughput of the experiment was compromised for the first year decreasing rapidly during 2002. It was hypothesized that the reduction in detector performance was due to a buildup of frost on the outside detector window, and not on the detector itself. In early 2003, two “heating” experiments designed to warm the detector window by pointing the detector side of TIMED toward Earth in order to sublimate away the frost were performed. These led to an immediate improvement in detector capability. Calibration measurements suggest that changes in throughput eased between 2015 and 2020 and that TIDI is in a stable configuration. Consequently, those zero-reference winds which have a time-dependency may require adjustment.
We found that the TIDI systematic bias (as illustrated in Figure 6; Figures S5 and S7 in Supporting Information S1) occurs only on the coldside and occurs only every other yaw cycle. TIDI yaw cycles are shown in Figure 2; the green lines mark the days (written in purple) when TIDI conducted yaw maneuvers. The bias in TIDI winds occurred on the coldside during yaw cycles 2, 4, and 6. During these yaw cycles, TIDI was flying in “forward” configuration. The data used in this study covers only six TIDI yaw cycles of 2020, but they are enough to highlight the repetitive character of the TIDI bias. Because the issue is most likely connected to the zero-wind baseline estimation, we expect this bias trend to be persistent. Similar examples from TIDI yaw cycles 4 (day 189) and 6 (day 304–305) are demonstrated in Figures S4–S7 in Supporting Information S1.
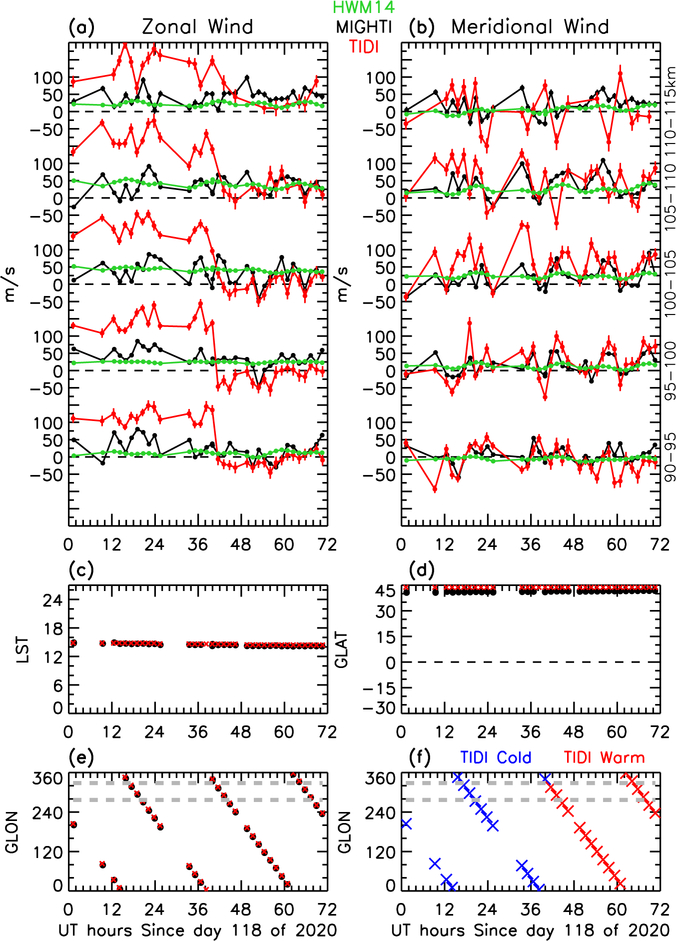
Fortunately, conjunctions between TIDI and MIGHTI also occurred when TIDI conducted a yaw maneuver from yaw cycle 2 to yaw cycle 3. This allowed us to investigate the TIDI bias problem further. Before the TIDI yaw maneuver on day 119, the winds in the regions where MIGHTI and TIDI conjunctions occurred were observed by TIDI coldside telescopes and TIDI was flying in forward configuration. However, after the yaw maneuver on day 119, TIDI started flying in backward configuration and warmside telescopes started to observed the regions that were earlier observed by TIDI coldside telescopes. Figure 7 illustrates this case by showing MLT winds from day 118–120. Before day 119, as shown in Figure 7, 15 LST at around 40 N latitude, was observed by TIDI coldside. After the yaw maneuver, TIDI warmside telescopes started to measure the same region. A sharp decrease in TIDI zonal wind at all altitudes is evident on day 119 when TIDI performed the yaw maneuver and the coldside became the warmside. This is a clear demonstration of the bias in TIDI winds. Interestingly, when compared to winds from days 72 to 73 (Figure 6), 102 to 103 (Figure S8 in Supporting Information S1), 116–117 (Figure S9 in Supporting Information S1), respectively, it appears that the bias in meridional winds subsided from day 72 to 117, but persisted in the zonal winds.
Figure 7.
Same as Figure 5, but showing days from 118 to 120 that cover yaw transition from cycle 2 to 3 on day 119. The shown transition is from coldside to warmside.
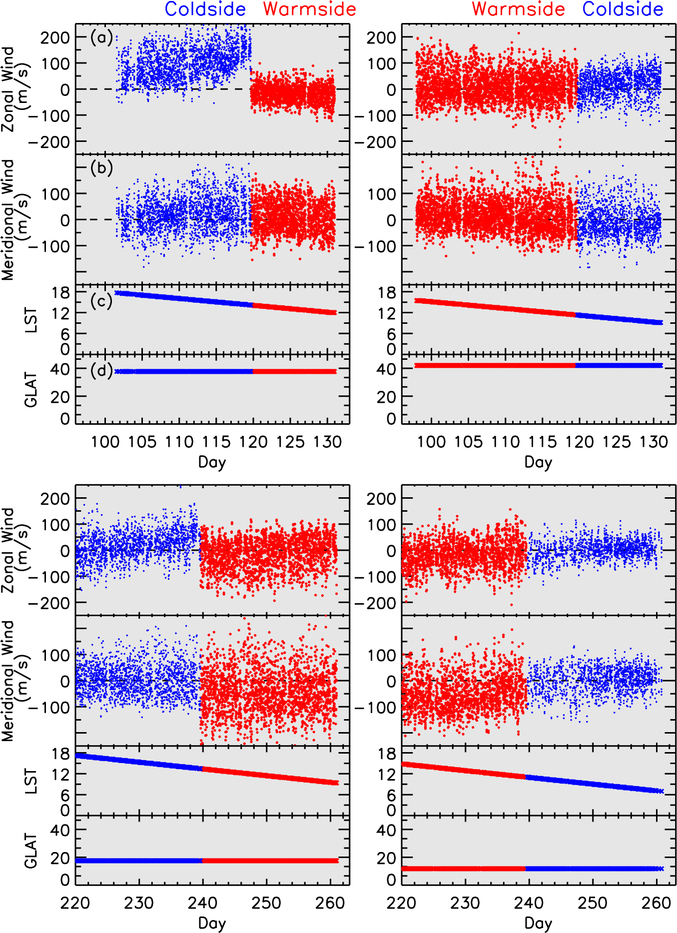
Figure 8 shows four examples (from two different days) of continuous TIDI wind measurements (rather than conjunctions) as a function of day number (in the form of day + UT/24) showing TIDI wind measurements before and after a yaw maneuver. The figure specifically shows the yaw cycle transitions from 2 to 3 and from 4 to 5. During these yaw cycles, TIDI continuously measured coldside and warmside winds for more than ±10 days around the yaw maneuvers without any gap associated with the solar beta angle. TIDI measures two LSTs simultaneously (one on the coldside and other on the warmside), so there are two panels in this figure for each day group (days 96–133 and 220–262). The fixed latitudes shown in the figure are selected so that they match with the MIGHTI and TIDI conjunction comparisons shown earlier. In both the examples, LST is changing slowly due to slow precession of the TIDI orbit. The only other change is the day number (seasonal change). However, in both the examples, a discontinuity in the TIDI zonal wind is present when the TIDI coldside telescopes point toward the new coldside (previously it was warmside) after a yaw maneuver. No such feature exists when the TIDI warmside telescopes point toward the new warmside (previously it was coldside) after a yaw maneuver. As discussed earlier, the bias in meridional winds subsided from day 72 to 117; however, an overall shift in meridional wind baseline is visible in the case when the yaw cycle changes from 4 to 5. As illustrated in latitude, longitude, and LST plots below each wind data example, TIDI warmside telescopes measured almost the same space-time region that was measured earlier by the coldside telescopes and vice versa. Thus, in an ideal situation, the wind transition from coldside to warmside (and vice versa) would be continuous.
Figure 8.
(a) TIDI zonal and (b) meridional winds (all longitudes, not just at MIGHTI and TIDI conjunctions) at the shown (c) local solar times and (d) latitudes. The top two subplots show days between 96 and 133, and the bottom two subplots show days between 220 and 262. These days cover TIDI yaw cycle transitions occurring on days 119 and 239. TIDI covers two local times each day; the left column show TIDI one local time and the right column show other local time. The blue and red colors indicate measurements from coldside and warmside telescopes, respectively. The left and right columns panels show transitions from coldside to warmside and warmside to coldside telescopes, respectively.
It is important to note that the coldside winds are not always biased; they are biased only during yaw cycles 2, 4, and 6. TIDI was flying in “backward” configuration during the yaw cycles 1, 3, and 5 and in “forward” configuration during yaw cycles 2, 4, and 6. Therefore, we find that TIDI coldside winds are biased when TIDI flies in a forward configuration and we expect this bias trend to continue in future.
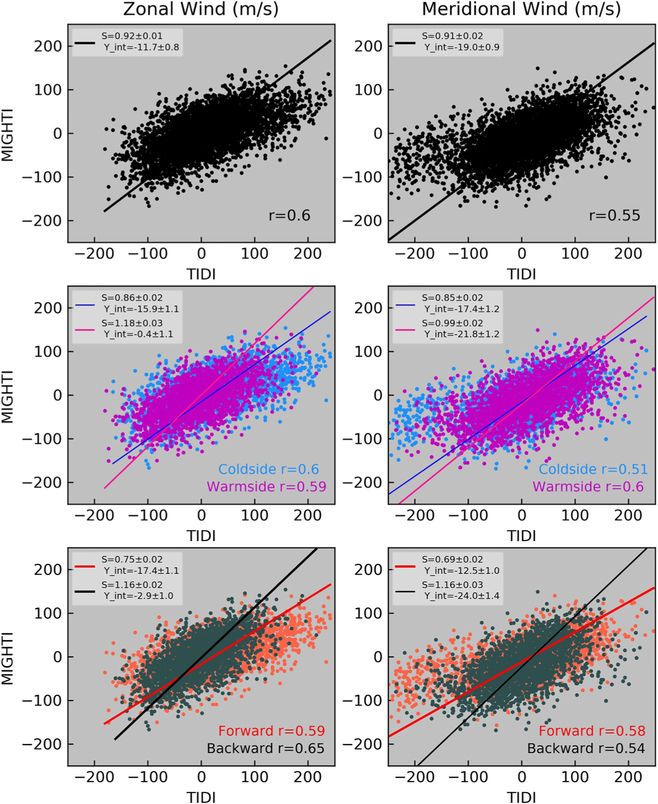
Further, we compared MIGHTI and TIDI conjunction winds statistically using the scatter plot graphical representation shown in Figure 9. As both datasets of wind distributions are linearly related, theoretically they should form a straight line. The top two panels include all the MIGHTI and TIDI conjunctions. The fitted linear curve using orthogonal distance regression (ODR) with wind errors involved in the fitting process is also shown. The ODR involving wind errors is the appropriate approach for comparing two stochastic data sets; note that the TIDI wind errors (typically 12 m/s) are typically much larger than MIGHTI (typically 4 m/s). The slope, y-intercept of the fitted linear curve, and Pearson correlation coefficients for wind are also shown in each panel. The slope of the linear fit provides a quantitative measure of how different/similar the wind magnitudes are in the two datasets, whereas the correlation coefficient informs about the common variance in the two datasets. Although MIGHTI and TIDI wind variations seem highly correlated visually, their zonal and meridional winds show moderate correlations of 0.60 and 0.55, respectively. The RMSD in zonal and meridional winds are 56 and 66 m/s, respectively. The slopes of fit are almost the same for zonal (0.92) and meridional winds (0.91). The slopes of less than 1 and moderate correlations are likely due to the presence of the bias in TIDI winds which skews the wind distribution but could also include additional systematic errors not accounted for in the TIDI and/or MIGHTI data sets. Furthermore Figure 9 shows scatter plots for conjunctions on TIDI coldside and warmside (middle panels), and for TIDI forward and backward configuration (bottom panels) separately. The data points that deviate the most from slope 1 are from the coldside (shown in blue in second row) and when TIDI was flying in forward configuration (shown in orange in the third row). The correlation for the backward case is stronger for zonal wind and weaker for meridional wind. However, we found earlier that TIDI winds are biased on the coldside only when TIDI moves in forward configuration; therefore, we also investigated MIGHTI and TIDI conjunction winds statistically when TIDI flew in forward configuration as shown in Figure S11 in Supporting Information S1; the coldside data shown in blue clearly deviates from the slope 1. The warmside slopes are much closer to 1 and correlations are stronger than for the coldside. The zonal and meridional RMSD for forward warm/coldside are 50–81 and 60–81 m/s, respectively. Similarly, the zonal and meridional RMSD for backward warm/coldside are 48–41 and 67–57 m/s, respectively.
Figure 9.
Comparison of MIGHTI and TIDI zonal winds (left column) and meridional winds (right column) at conjunctions between 95 and 110 km. The top panels show winds at conjunctions collectively. The middle panels show winds at conjunctions from coldside and warmside telescopes separately. The bottom panels show winds at conjunctions from forward and backward traveling configurations of TIDI separately. Each panel show slopes (S) and intercepts (Y-int) obtained with orthogonal distance regression with involving wind errors in the fitting process. The correlation coefficient is also shown on the bottom of each panel. The color label descriptions are given in each panel.
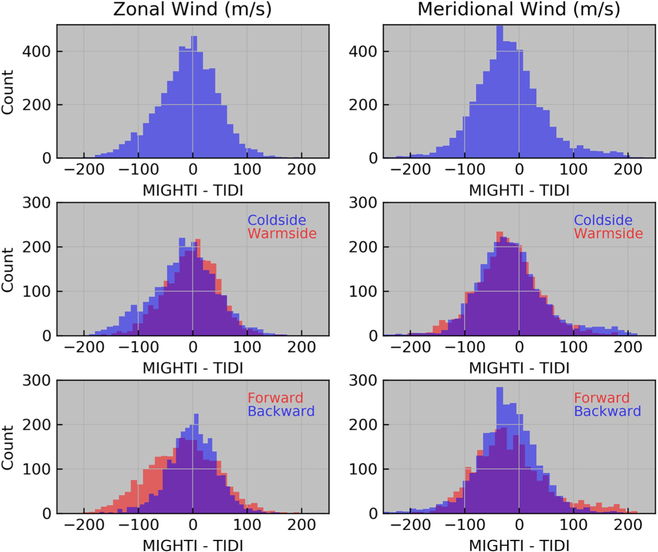
Figure 9 and Figure S11 in Supporting Information S1 show significant scatter around the lines of slope 1, and there can be several reasons for this behavior. The major reasons for the scatter likely include the fact that the MIGHTI and TIDI observations are not taken at the exact same time and location and that there is a difference in MIGHTI and TIDI observation geometries. TIDI and MIGHTI face the same challenges as ground-based and space-based comparison studies such as (Gault et al., 1996; Harding et al., 2021; Killeen et al., 1984; Makela et al., 2021). For ground-based and space-based conjunctions, their viewing geometries are different and both instruments look though different media affecting the signal recorded by the sensor differently. The same is true for TIDI and MIGHTI. Because of the differences in TIDI and MIGHTI orbits, they are looking at approximately the same tangent point location but though different media along their line of sights; the difference in viewing geometries likely accounts for some of the scatter in the comparison plots. Some of the scatter can also be attributed to the statistical noise in each instrumenťs measurements. Figure 10 shows the histograms of differences in MIGHTI and TIDI winds. The rows and columns are in the same format as shown in Figure 9, but the depicted data is the difference between MIGHTI and TIDI wind components. Overall the zonal wind differences (ZWD—shown on top) peak around 0 m/s, but the ZMD distribution is skewed toward the left. As manifested in the coldside and warmside ZWD (shown in first column, middle panel), and forward and backward ZWD (shown in first column, bottom panel), the skewing in ZWD is caused by the TIDI coldside measurements when flying in forward configuration. However, the meridional wind differences (MWD) peak around −33 m/s (top panel). The distribution appears normal with major differences in the tail on the right. The manifestation in coldside MWD (shown in second column, middle panel) and forward MWD (shown in second column, bottom panel) demonstrates that the differences in the tail are caused by the TIDI coldside measurements when flying in the forward configuration. The same discussion as for Figure 9 and Figure S11 in Supporting Information S1 also applies to Figure 10.
Figure 10.
Histograms of MIGHTI and TIDI wind differences between 95 and 110 km. The top panels include all MIGHTI and TIDI conjunctions between 95 and 110 km. The middle panels include measurements from TIDI (and MIGHTI) coldside and warmside telescopes separately. The bottom panels show measurements from TIDI (and MIGHTI) forward and backward traveling configurations separately. The color label descriptions are given in each panel.
As discussed earlier (in the discussion associated with Figure 6 and Figures S5–S9 in Supporting Information S1), the correlated wind fluctuations and systematic differences (on TIDI coldside and forward moving) between MIGHTI and TIDI at all altitudes suggest that the TIDI bias origin lies in the zero-wind calibration. The zero-wind baseline calculation for optical instruments has remained a topic of discussion since their inception (e.g., Aruliah & Rees, 1995). The TIDI zero-baseline for each telescope were designed to address instrument performance issues post-launch and were never revised later. Rapid sublimation of frost from the outside of the TIDI detector window required that some of the 4 × 2 zero-wind estimates have a time-dependency. This study demonstrates that the old zero-wind baselines are no longer valid (at least for the coldside telescopes) and a proper revision is required. The current TIDI/MIGHTI study provides guidance toward improving the TIDI analysis software package.
An alternate way to remove the TIDI bias is to adjust the winds using HWM14 as a baseline. The current version of MIGHTI winds utilize HMW14 winds as baseline. Figure 11 demonstrates an example of the result of removing the TIDI bias with HWM14 winds as a baseline on days 72–73 (check Figure 6). In this process, we first calculated a bias baseline separately for zonal and meridional winds by removing mean daily HWM14 winds from mean daily TIDI winds (bias baseline = daily TIDI wind average - daily HWM14 wind average). Then the calculated bias baseline was removed from the TIDI winds (TIDI corrected = TIDI - bias baseline). The corrected TIDI winds are shown in Figure 11. This quick method shows remarkable improvement in MIGHTI and TIDI wind agreement. Thus, fixing TIDI winds based on HWM14 can serve as a fairly straightforward and quick fix until the TIDI zero-wind calibration of the TIDI observations is revised. However, there may be some limitations of using this method because of the known discrepancies between observations and HWM14 (e.g., Malki et al., 2018; Meriwether et al., 2016).
Figure 11.
Same as Figure 6, but here using corrected TIDI winds by removing HWM14 baseline.
5. Conclusions
This investigation is the first to cross-compare ICON/MIGHTI and TIMED/TIDI MLT region neutral wind measurements from the low Southern Hemisphere (12°S) to middle Northern Hemisphere latitudes (42°N). We used MIGHTI level 2.2 (v4) data and University of Michigan TIDI level 3 (v11) from January 2020 to November 2020 for this investigation. For finding conjunctions between MIGHTI and TIDI, we used a space-time window of LST±15 min, latitude±4°, and longitude±4° around each TIDI wind measurement. A total of ~8,200 conjunctions (binned and averaged) occurred between MIGHTI and TIDI during this period covering various seasons, local time, latitudes, and longitudes. TIDI is in a high inclination (74°) orbit and MIGHTI is in a low inclination (27°) orbit. Because of their orbital geometry, frequent conjunctions of their measurement locations, which are spread over wide geographic regions, are occurring between them. The frequent conjunctions and their fully resolved horizontal winds provide us an unprecedented opportunity to perform the first ever, large-scale cross-calibration study of MLT neutral winds from two independent space-based optical sensors. In addition, the nature of their orbits is such that conjunctions are spread in longitudes and occurring at around fixed LST and latitudes. Therefore, their conjunctions provide an opportunity to compare longitudinal variability from two independent space-based optical platforms. In addition, the results of this study act as a validation of MIGHTI lower thermospheric winds.
Individual day comparisons show that MIGHTI and TIDI wind observation agree well (except on the TIDI coldside during forward flight) and show similar large amplitude longitudinal variations in MLT winds that can reach amplitudes of more than 100 m/s. Comparisons show that with increasing altitude, these longitudinal variations in MLT winds at fixed LST retain their shape but show phase progression. These behaviors suggest that these longitudinal variations are likely the signatures of upward propagating non-migrating tides in MLT winds. Such longitudinal signatures of nonmigrating tides can only be detected with space-based instruments or distributed networks of ground-based instruments.
We found that TIDI coldside measurements in forward flight show a systematic bias and this behavior is repetitive as the instrument pointing direction is changed by a yaw maneuver. The similarity between MIGHTI and TIDI wind fluctuations and a consistent offset between them at all the altitudes suggests that the offset origin lies in the zero-wind calibration of TIDI the data. Fortunately, some MIGHTI and TIDI conjunctions occurred on the days when TIMED made yaw maneuvers. An abrupt shift in winds measured before and after the yaw maneuvers confirms that the TIDI zero-wind baseline is the root of the problem. The TIDI zero-wind baselines for each of the four individual telescopes (one set for forward flight and the second for backward flight) were calculated at the start of the mission. Rapid sublimation of frost on the outside of the TIDI detector window required zero-wind estimates to have a time-dependency. Calibration measurements suggest that changes in throughput eased between 2015 and 2020 and that TIDI is now in a stable configuration. The nature of the bias between TIDI and MIGHTI suggests that the TIDI zero references, which have a time-dependence, may require adjustment. The current TIDI/MIGHTI study can provide guidance toward improving the TIDI data analysis.
MIGHTI and TIDI zonal and meridional winds show moderate correlations of 0.60 and 0.55, respectively. The slopes of regression fits using ODR for zonal and meridional winds are 0.92 and 0.91, respectively. The RMSD in zonal and meridional winds are 56 and 66 m/s, respectively. The zonal and meridional RMSD for forward warm/coldside are 50–81 and 60–81 m/s, respectively. Similarly, the zonal and meridional RMSD for backward warm/coldside are 48–41 and 67–57 m/s, respectively. It must be noted that MIGHTI and TIDI measurements are not expected to always be identical because the TIDI and MIGHTI observations compared here are not taken at the exact same time and location and because the instruments are integrating along the different viewing geometries. Thus, some of the scatter in the observations can be attributed to the temporal and spatial variability, in addition to the effect of different gradients in the parameters along the differing viewing geometries.
The offset in TIDI winds is associated with its zero-wind calibration, thus we expect this bias trend to continue in the future until the TIDI zero-wind calibration is revised. An alternate way to fix the TIDI bias is to constrain TIDI mean winds to match HWM14 as illustrated in detail with an example in the results section of this paper. So far TIDI data is the most extensive archive of global MLT neutral winds collected by the aeronomy community. The recently launched ICON/MIGHTI has dramatically increased our equatorial to middle latitude coverage of neutral winds. MIGHTI and TIDI collectively can provide much needed global monitoring of MLT neutral winds with better LST coverage than single space-based instruments. This is required for a more comprehensive understanding of macroscale and mesoscale dynamics and further enhances our knowledge of the contribution of terrestrial weather to ionospheric and thermospheric variability. Thus, a future TIDI wind data revision would be highly beneficial for future space weather research.
Supplementary Material
Key Points:
Cross-compare ICON/MIGHTI and Thermosphere, Ionosphere, Mesosphere Energetics & Dynamics (TIMED)/TIMED Doppler Interferometer (TIDI) MLT region neutral winds
Overall,MIGHTI and TIDI neutral wind measurements are in agreement
TIDI coldside measurements in forward flight show systematic bias
Acknowledgments
The authors acknowledge support from NASA 18-LWS18-0041, NN-H19ZDA001N-HGIO, and the Office of Naval Research. CRE was supported by NASA's Explorers Program through contract NNG12FA42I.
Footnotes
Supporting Information:
Supporting Information may be found in the online version of this article.
Data Availability Statement
MIGHTI/ICON level 2.2 (v4) data are available at https://icon.ssl.berkeley.edu/Data. TIDI level 3 (v11) vector winds are available at https://tidi.engin.umich.edu/. Current Horizontal Wind Model is available at https:/map.nrl.navy.mil/map/pub/nrl/HWM/HWM14/. The authors are thankful to the broader TIDI and MIGHTI teams.
References
- Aruliah AL, Förster M, Hood R, McWhirter I, & Doornbos E (2019). Comparing high-latitude thermospheric winds from Fabry-Perot interferometer (FPI) and challenging mini-satellite payload (CHAMP) accelerometer measurements. Annales Geophysicae, 37(6), 1095–1120. 10.5194/angeo-37-1095-2019 [DOI] [Google Scholar]
- Aruliah AL, & Rees D (1995). The trouble with thermospheric vertical winds: Geomagnetic, seasonal and solar cycle dependence at high latitudes. Journal of Atmospheric and Terrestrial Physics, 57(6), 597–609. 10.1016/0021-9169(94)00100-3 [DOI] [Google Scholar]
- Dhadly M, & Conde M (2017). Trajectories of thermospheric air parcels flowing over Alaska, reconstructed from ground-based wind measurements. Journal of Geophysical Research: Space Physics, 122(6), 6635–6651. 10.1002/2017JA024095 [DOI] [Google Scholar]
- Dhadly M, Emmert JT, Drob DP, Conde MG, Aruliah A, Doornbos E, & Ridley AJ (2019). HL-TWiM empirical model of high-latitude upper thermospheric winds. Journal of Geophysical Research: Space Physics, 124, 2019JA027188. 10.1029/2019JA027188 [DOI] [Google Scholar]
- Dhadly M, Emmert JT, Drob D, Conde M, Doornbos E, Shepherd G, et al. (2017). Seasonal dependence of northern high-latitude upper thermospheric winds: A quiet time climatological study based on ground-based and space-based measurements. Journal of Geophysical Research: Space Physics, 122(2), 2619–2644. 10.1002/2016JA023688 [DOI] [Google Scholar]
- Dhadly M, Emmert JT, Drob D, Conde M, Doornbos E, Shepherd G, et al. (2018). Seasonal dependence of geomagnetic active-time northern high-latitude upper thermospheric winds. Journal of Geophysical Research: Space Physics, 123(1), 739–754. 10.1002/2017JA024715 [DOI] [Google Scholar]
- Dhadly M, Emmert JT, Drob DP, McCormack JP, & Niciejewski RJ (2018). Short-term and interannual variations of migrating diurnal and semidiurnal tides in the mesosphere and lower thermosphere. Journal of Geophysical Research: Space Physics, 123(8), 7106–7123. 10.1029/2018ja025748 [DOI] [Google Scholar]
- Doornbos E, Den Ijssel JV, Lühr H, Förster M, Koppenwallner G, Bruinsma S, & Perosanz F (2010). Neutral density and crosswind determination from arbitrarily oriented multiaxis accelerometers on satellites. Journal of Spacecraft and Rockets, 47(4), 580–589. 10.2514/1.48114 [DOI] [Google Scholar]
- Drob DP, Emmert JT, Meriwether JW, Makela JJ, Doornbos E, Conde M, & Klenzing JH (2015). An update to the Horizontal Wind Model (HWM): The quiet time thermosphere. Earth and Space Science, 2(7), 301–319. 10.1002/2014ea000089 [DOI] [Google Scholar]
- Duboin ML (1997). Dynamics of the thermosphere: Diurnal variations observed by WINDII on board UARS. Journal of Atmospheric and Solar-Terrestrial Physics, 59(6), 669–673. 10.1016/s1364-6826(96)00102–2 [DOI] [Google Scholar]
- Emmert JT, Drob DP, Shepherd GG, Hernandez G, Jarvis MJ, Meriwether JW, & Tepley CA (2008). DWM07 global empirical model of upper thermospheric storm-induced disturbance winds. Journal of Geophysical Research, 113(A11), A11319. 10.1029/2008ja013541 [DOI] [Google Scholar]
- England SL (2012). A review of the effects of non-migrating atmospheric tides on the Earth's low-latitude ionosphere. Space Science Reviews, 168(1–4), 211–236. 10.1007/s11214-011-9842-4 [DOI] [Google Scholar]
- Englert CR, Babcock DD, & Harlander JM (2007). Doppler asymmetric spatial heterodyne spectroscopy (DASH): Concept and experimental demonstration. Applied Optics, 46(29), 7297–7307. 10.1364/ao.46.007297 [DOI] [PubMed] [Google Scholar]
- Englert CR, Harlander JM, Brown CM, & Marr KD (2015). Spatial heterodyne spectroscopy at the Naval Research Laboratory. Applied Optics, 54(31), F158. 10.1364/ao.54.00f158 [DOI] [PubMed] [Google Scholar]
- Englert CR, Harlander JM, Brown CM, Marr KD, Miller IJ, Stump JE, & Immel TJ (2017). Michelson Interferometer for global high-resolution thermospheric imaging (MIGHTI): Instrument design and calibration. Space Science Reviews, 212(1–2), 553–584. 10.1007/s11214-017-0358-4 [DOI] [PMC free article] [PubMed] [Google Scholar]
- Forbes JM (2007). Dynamics of the thermosphere. Journal of the Meteorological Society of Japan, 85B, 193–213. 10.2151/jmsj.85b.193 [DOI] [Google Scholar]
- Forbes JM, Wu D, Forbes JM, & Wu D (2006). Solar tides as revealed by measurements of mesosphere temperature by the MLS experiment on UARS. Journal of the Atmospheric Sciences, 63(7), 1776–1797. 10.1175/jas3724.1 [DOI] [Google Scholar]
- Förster M, Rentz S, Köhler W, Liu H, & Haaland SE (2008). IMF dependence of high-latitude thermospheric wind pattern derived from CHAMP cross-track measurements. Annales Geophysicae, 26(6), 1581–1595. 10.5194/angeo-26-1581-2008 [DOI] [Google Scholar]
- Gault WA, Thuillier G, Shepherd GG, Zhang SP, Wiens RH, Ward WE, et al. (1996). Validation of O(1 S) wind measurements by WINDII: The WIND Imaging Interferometer on UARS. Journal of Geophysical Research: Atmospheres, 101(D6), 10405–10430. 10.1029/95JD03352 [DOI] [Google Scholar]
- Hagan ME, Maute A, & Roble RG (2009). Tropospheric tidal effects on the middle and upper atmosphere. Journal of Geophysical Research: Space Physics, 114(A1). 10.1029/2008JA013637 [DOI] [Google Scholar]
- Hagan ME, Maute A, Roble RG, Richmond AD, Immel TJ, & England SL (2007). Connections between deep tropical clouds and the Earth's ionosphere. Geophysical Research Letters, 34(20), L20109. 10.1029/2007GL030142 [DOI] [Google Scholar]
- Harding BJ, Chau JL, He M, Englert CR, Harlander JM, Marr KD, & Immel TJ (2021). Validation of ICON-MIGHTI thermospheric wind observations: 2. Green-line comparisons to specular meteor radars. Journal of Geophysical Research: Space Physics, e2020JA028947. 10.1029/2020JA028947 [DOI] [PMC free article] [PubMed] [Google Scholar]
- Harding BJ, Makela JJ, Englert CR, Marr KD, Harlander JM, England SL, & Immel TJ (2017). The MIGHTI Wind Retrieval Algorithm: Description and verification. Space Science Reviews, 212(1–2), 585–600. 10.1007/s11214-017-0359-3 [DOI] [PMC free article] [PubMed] [Google Scholar]
- Hays PB, Killeen TL, & Kennedy BC (1981). The Fabry-Perot interferometer on dynamics explorer. Space Science Instrumentation, 5, 395–416. [Google Scholar]
- Heelis R, & Maute A (2020). Challenges to understanding the Earth's ionosphere and thermosphere. Journal of Geophysical Research: Space Physics. 10.1029/2019JA027497 [DOI] [PMC free article] [PubMed] [Google Scholar]
- Immel TJ, England SL, Mende SB, Heelis RA, Englert CR, Edelstein J, & Sirk MM (2018). The ionospheric connection explorer mission: Mission goals and design. Space Science Reviews, 214(1), 13. 10.1007/s11214-017-0449-2 [DOI] [PMC free article] [PubMed] [Google Scholar]
- Immel TJ, Harding BJ, Heelis RA, Maute A, Forbes JM, England SL, & Makela JJ (2021). Control of ionospheric plasma velocities by thermospheric winds. Nature. 10.21203/RS.3.RS-131770/V1 [DOI] [PMC free article] [PubMed] [Google Scholar]
- Kelly MC (1989). The Earth's ionosphere: Plasma physics and electrodynamics (Vol. 43). Academic Press. [Google Scholar]
- Killeen TL (1987). Energetics and dynamics of the Earth's thermosphere. Reviews of Geophysics, 25(3), 433–454. 10.1029/rg025i003p00433 [DOI] [Google Scholar]
- Killeen TL, & Roble RG (1986). An analysis of the high-latitude thermospheric wind pattern calculated by a thermospheric general circulation model: 2. Neutral parcel transport. Journal of Geophysical Research, 91(A10), 11291. 10.1029/JA091IA10P11291 [DOI] [Google Scholar]
- Killeen TL, & Roble RG (1988). Thermosphere dynamics: Contributions from the first 5 years of the Dynamics Explorer Program. Reviews of Geophysics, 26(2), 329–367. 10.1029/RG026i002p00329 [DOI] [Google Scholar]
- Killeen TL, Skinner WR, Johnson RM, Edmonson CJ, Wu Q, Niciejewski RJ, & Kafkalidis JF (1999). TIMED Doppler Interferometer (TIDI). International Society for Optics and Photonics. 10.1117/12.366383 [DOI] [Google Scholar]
- Killeen TL, Smith RW, Hays PB, Spencer NW, Wharton LE, & McCormac FG (1984). Neutral winds in the high latitude winter F-region: Coordinated observations from ground and space. Geophysical Research Letters, 11(4), 311–314. 10.1029/GL011I004P00311 [DOI] [Google Scholar]
- Killeen TL, Wu Q, Solomon SC, Ortland DA, Skinner WR, Niciejewski RJ, & Gell DA (2006). TIMED Doppler Interferometer: Overview and recent results. Journal of Geophysical Research, 111(A10), A10S01. 10.1029/2005ja011484 [DOI] [Google Scholar]
- Lindzen RS (1981). Turbulence and stress owing to gravity wave and tidal breakdown. Journal of Geophysical Research, 86(C10), 9707. 10.1029/jc086ic10p09707 [DOI] [Google Scholar]
- Makela JJ, Baughman M, Navarro LA, Harding BJ, Englert CR, Harlander JM, & Immel TJ (2021). Validation of ICON-MIGHTI thermospheric wind observations: 1. Nighttime red-line ground-based Fabry-Perot Interferometers. Journal of Geophysical Research: Space Physics, 126(2), e2020JA028726. 10.1029/2020JA028726 [DOI] [PMC free article] [PubMed] [Google Scholar]
- Malki K, Bounhir A, Benkhaldoun Z, Makela JJ, Vilmer N, Fisher DJ, et al. (2018). Ionospheric and thermospheric response to the 27–28 February 2014 geomagnetic storm over North Africa. Annales Geophysicae, 36(4), 987–998. 10.5194/ANGEO-36-987-2018 [DOI] [Google Scholar]
- Meriwether JW (2006). Studies of thermospheric dynamics with a Fabry-Perot Interferometer Network: A review. Journal of Atmospheric and Solar-Terrestrial Physics, 68(13), 1576–1589. 10.1016/j.jastp.2005.11.014 [DOI] [Google Scholar]
- Meriwether JW, Makela JJ, & Fisher DJ (2016). Simultaneous measurements and monthly climatologies of thermospheric winds and temperatures in the Peruvian and Brazilian longitudinal sectors. In Fuller-Rowell T, Yizengaw E, Doherty PH, & Basu S (Eds.), Ionospheric space weather: Longitude and hemispheric dependences and lower atmosphere forcing (pp. 175–186). American Geophysical Union. 10.1002/9781118929216.ch15 [DOI] [Google Scholar]
- Niciejewski R, Wu Q, Skinner W, Gell D, Cooper M, Marshall A, et al. (2006). TIMED Doppler interferometer on the thermosphere ionosphere mesosphere energetics and dynamics satellite: Data product overview. Journal of Geophysical Research, 111(A11), A11S90. 10.1029/2005ja011513 [DOI] [Google Scholar]
- Oberheide J, Wu Q, Killeen TL, Hagan ME, & Roble RG (2006). Diurnal nonmigrating tides from TIMED Doppler Interferometer wind data: Monthly climatologies and seasonal variations. Journal of Geophysical Research, 111(A10), A10S03. 10.1029/2005JA011491 [DOI] [Google Scholar]
- Richmond AD, Lathuillere C, & Vennerstroem S (2003). Winds in the high-latitude lower thermosphere: Dependence on the interplanetary magnetic field. Journal of Geophysical Research, 108(A2), 1066. 10.1029/2002JA009493 [DOI] [Google Scholar]
- Rishbeth H (1972). Thermospheric winds and the F-region: A review. Journal of Atmospheric and Terrestrial Physics, 34(1), 1–47. 10.1016/0021-9169(72)90003-7 [DOI] [Google Scholar]
- Shepherd GG, Thuillier G, Cho Y-M, Duboin M-L, Evans WFJ, Gault WA, & Ward WE (2012). The Wind Imaging Interferometer (WINDII) on the Upper Atmosphere Research Satellite: A 20 year perspective. Reviews of Geophysics, 50(2). 10.1029/2012RG000390 [DOI] [Google Scholar]
- Shepherd GG, Thuillier G, Gault WA, Solheim BH, Hersom C, Alunni JM, et al. (1993). WINDII, the wind imaging interferometer on the Upper Atmosphere Research Satellite. Journal of Geophysical Research, 98(D6), 10725. 10.1029/93jd00227 [DOI] [Google Scholar]
- Smith AK (1996). Longitudinal variations in mesospheric winds: Evidence for gravity wave filtering by planetary waves. Journal of the Atmospheric Sciences, 53(8), 1156–1173. [DOI] [Google Scholar]
- Smith AK (2004). Physics and chemistry of the mesopause region. Journal of Atmospheric and Solar-Terrestrial Physics, 66(10), 839–857. 10.1016/j.jastp.2004.01.032 [DOI] [Google Scholar]
- Spencer NW, Wharton LE, Niemann HB, Hedin AE, Carrignan GR, & Maurer JC (1981). The dynamics explorer wind and temperature spectrometer. Space Science Instrumentation, 5, 417–428. [Google Scholar]
- Wang W, Burns AG, & Liu J (2021). Upper thermospheric winds. In Wang W, Zhang Y, & Paxton L (Eds.), Upper atmosphere dynamics and energetics (pp. 41–63). American Geophysical Union. 10.1002/9781119815631.ch3 [DOI] [Google Scholar]
- Wu YJJ, Harding BJ, Triplett CC, Makela JJ, Marr KD, Englert CR, & Immel TJ (2020). Errors from asymmetric emission rate in spaceborne, Limb Sounding Doppler Interferometry: A correction algorithm with application to ICON/MIGHTI. Earth and Space Science, 7(10), e2020EA001164. 10.1007/s11214-017-0359-310.1029/2020EA001164 [DOI] [PMC free article] [PubMed] [Google Scholar]
- Yee J-H, Cameron GE, & Kusnierkiewicz DY (1999). Overview of TIMED. In Larar AM (Ed.), Optical Spectroscopic Techniques and Instrumentation for Atmospheric and Space Research III (Vol. 3756, p. 244). SPIE. 10.1117/12.366378 [DOI] [Google Scholar]
- Yigit E, Koucká Knížová P, Georgieva K, & Ward W (2016). A review of vertical coupling in the Atmosphere-Ionosphere system: Effects of waves, sudden stratospheric warmings, space weather, and of solar activity. Journal of Atmospheric and Solar-Terrestrial Physics, 141, 1–12. 10.1016/j.jastp.2016.02.011 [DOI] [Google Scholar]
Associated Data
This section collects any data citations, data availability statements, or supplementary materials included in this article.
Supplementary Materials
Data Availability Statement
MIGHTI/ICON level 2.2 (v4) data are available at https://icon.ssl.berkeley.edu/Data. TIDI level 3 (v11) vector winds are available at https://tidi.engin.umich.edu/. Current Horizontal Wind Model is available at https:/map.nrl.navy.mil/map/pub/nrl/HWM/HWM14/. The authors are thankful to the broader TIDI and MIGHTI teams.


