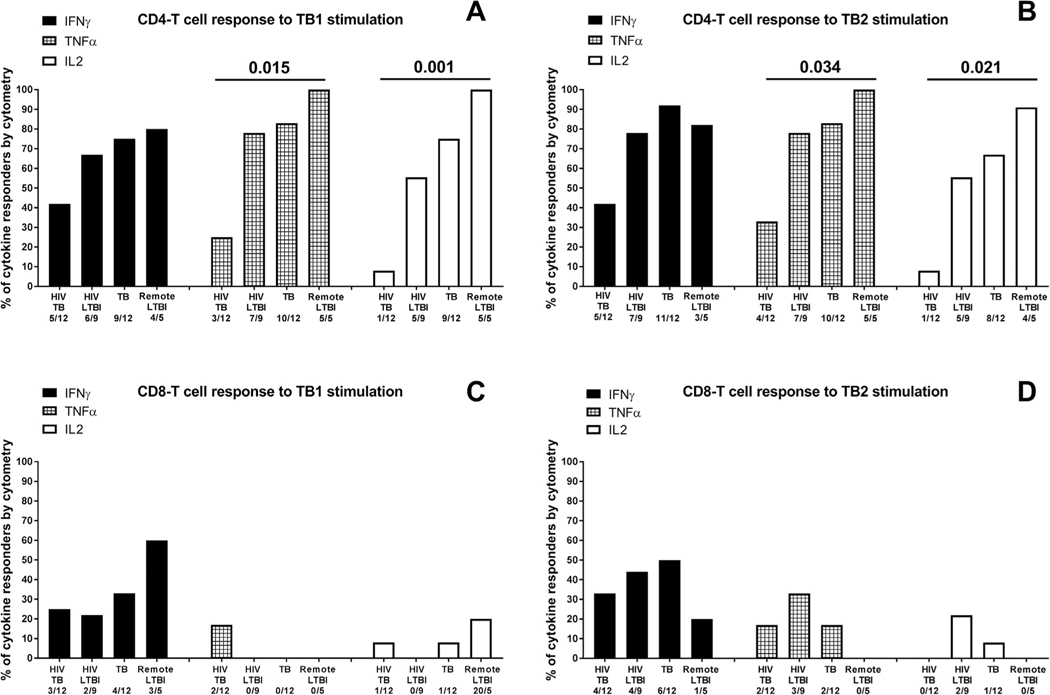
Fig. 4. Proportion of responders to TB1 and TB2 stimulation of the QFT-Plus test evaluated by flow cytometry.
Responders were defined based on IFN-γ or TNF-α or IL-2 production by CD4+ and CD8+ T-cells. A) CD4 T-cell response and CD8+ T-cell response to TB1 and TB2 stimulation considering only the remote LTBI in the in the HIV- uninfected LTBI group.The “x axis” reports the number of responders over total, for each group and for each cytokine. The statistical analysis has been performed comparing all the HIV-infected individuals with all the HIV-uninfected individuals using the Fisher exact test. The data are presented as proportion of responders for each cytokine. Footnotes: IFN: interferon; TNF: tumor necrosis factor; IL: interleukin.

