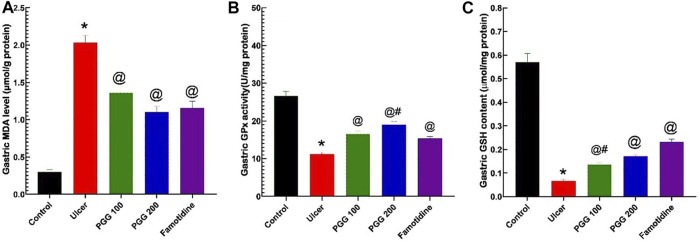
FIGURE 7.
Results from the malondialdehyde (MDA) level (A), glutathione peroxidase activity (GPx), (B) and reduced glutathione content (GSH) (C) in gastric tissues. The data are shown as the mean ± SEM (n = 6). *, @, #Mean values with different symbols are significantly different (p < 0.05) according to one-way ANOVA followed by Tukey’s post hoc test vs. control, indomethacin ulcer, or famotidine groups, respectively.

