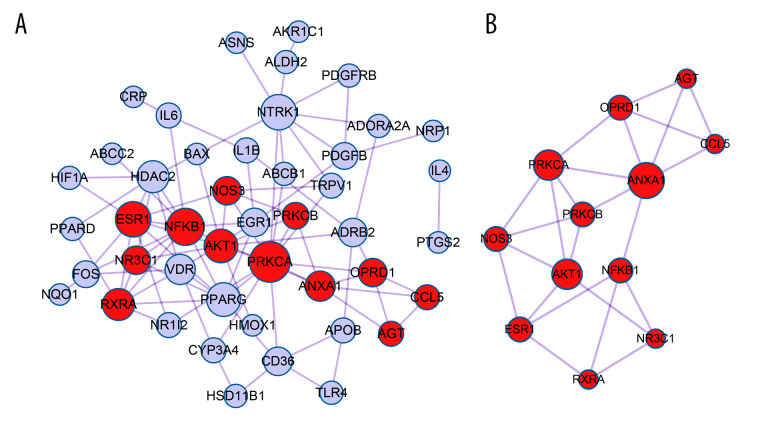
Figure 3. Construction of protein–protein interaction (PPI) network using Cytoscape (version 3.4.0, http://chianti.ucsd.edu/cytoscape-3.4.0/).
(A) Identification of PPI pair via online tool Metascape. Edge represents the protein–protein interaction and red node represents gene in module. (B) Screening of module from PPI network by using MCODE algorithm. The size of the node represents the degree value of node.

