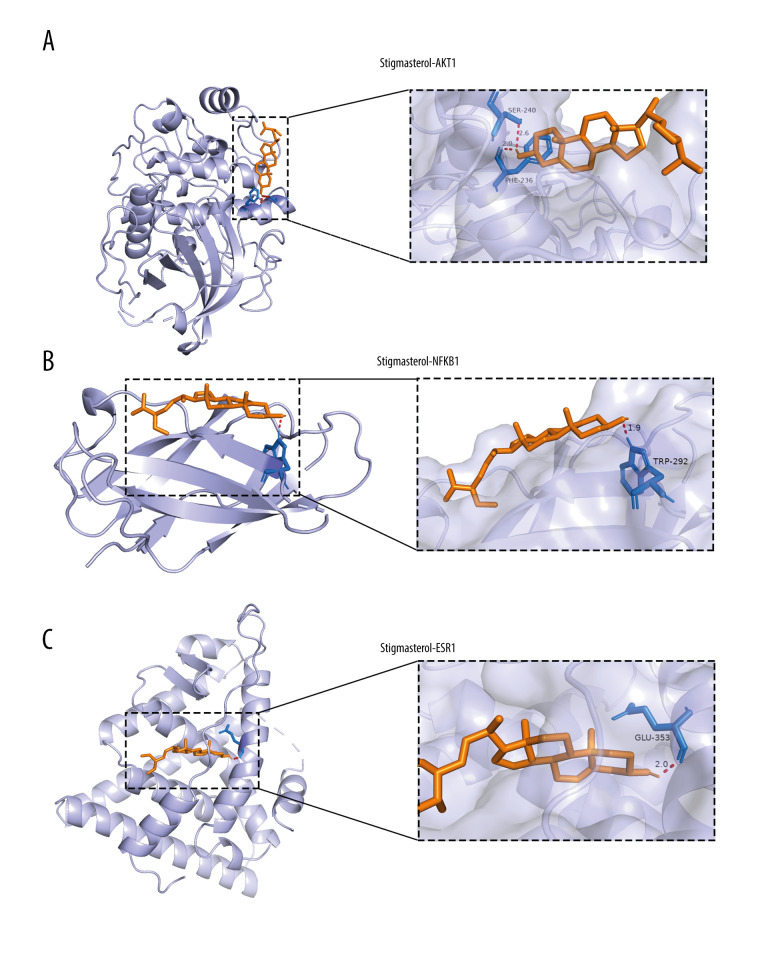
Figure 5. Molecular docking analysis of stigmasterol with AKT1.
(A),NFKB1 (B), andESR1 (C) using AutoDock 4.2 software (Sousa, Fernandes & Ramos). Purple, orange, red, and blue represent protein receptor, small drug ligand, hydrogen bond, and amino acid residue, respectively. The length of bond is added to the bond.

