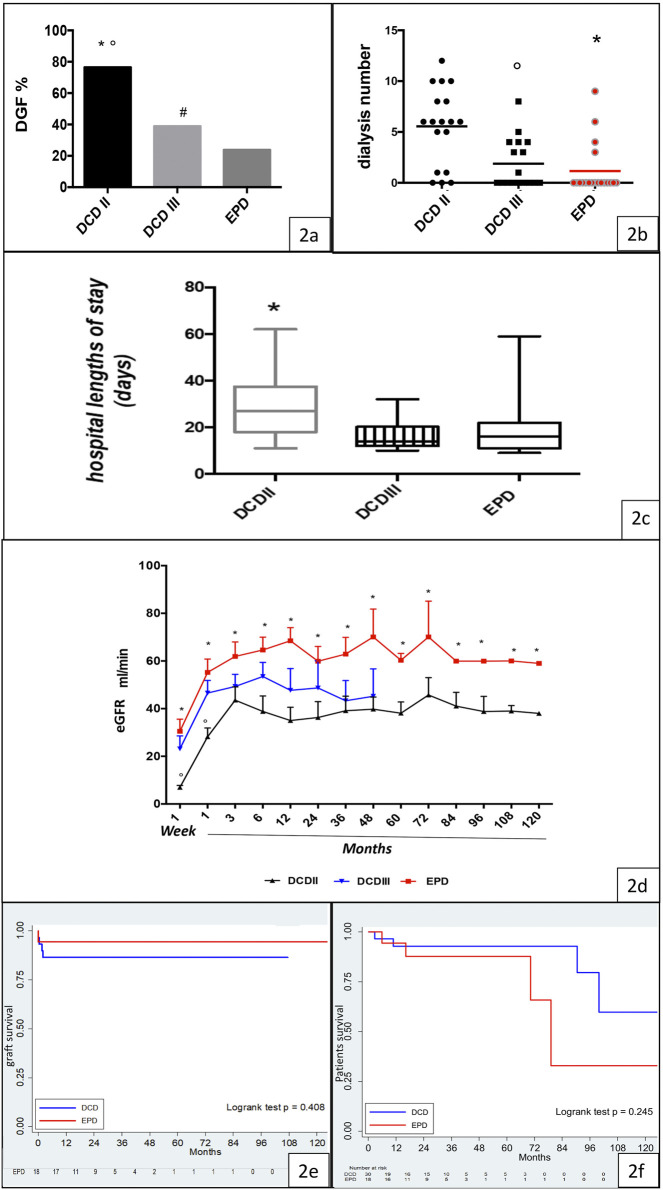
FIGURE 2.
Clinical outcome, graft function, and graft and patient survival in the DCD and EPD groups. (A) DGF rate in the Maastricht class II DCD, Maastricht class III DCD, and EPD groups (DCDII vs. DCDIII, *p < 0.0001; DCDII vs. EPD, °p < 0.0001; DCDIII vs. EPD, #p < 0.0001). (B) Dialysis requirement in Maastricht class II DCD, Maastricht class III DCD, and EPD recipients (EPD vs. DCDII, *p < 0.001; DCDIII vs. DCDII, °p < 0.05). (C) Hospital length of stay in the studied groups (DCDII vs. EPD, *p < 0.05). (D) eGFR in Maastricht class II DCD, Maastricht class III DCD, and EPD recipients (DCDII vs DCDIII, °p < 0.005; EPD vs. DCDII, *p < 0.001). (E) Kaplan-Meier curve of graft survival, by group (log rank test p = 0.408). (F) Kaplan-Meyer curve of patient survival, by group (log rank test p = 0.245).

