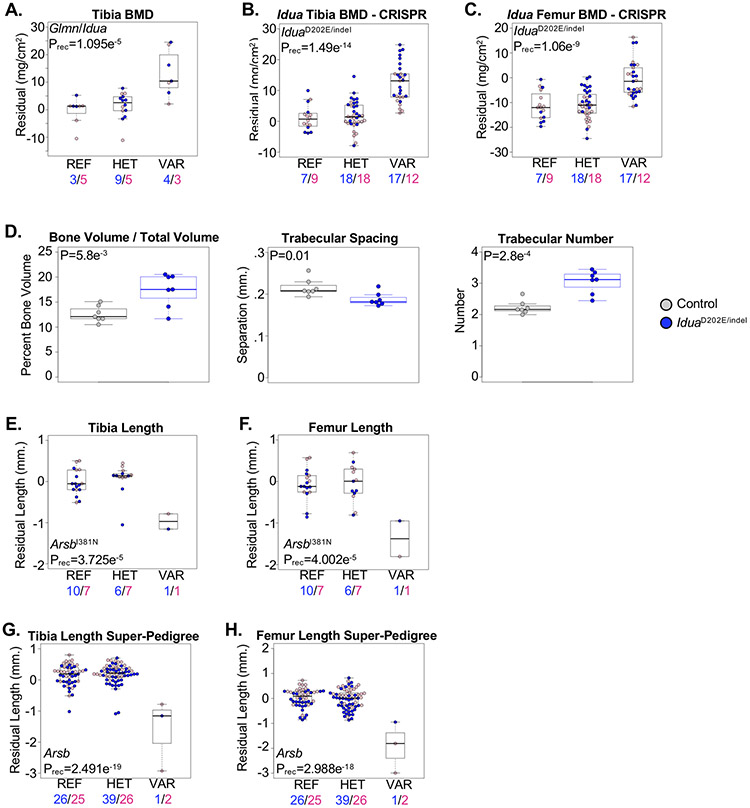
Figure 2.
Mouse models of human Mucopolysaccharidoses. (A) Mice homozygous for co-segregating alleles in the Glmn and Idua genes (VAR) developed a high bone mass phenotype compared to mice heterozygous for the alleles (HET) or homozygous for the reference allele (REF). Male and female mice are shown with blue and pink symbols, respectively, and the numbers of mice are shown below. (B,C) Compound heterozygous or homozygous mice harboring the IduaD202E and Idua p.S204Ffs*1 (Iduaindel) alleles (VAR) developed high bone mass evident in the (B) tibia and (C) femur compared to mice heterozygous for either allele (HET) or homozygous for the reference allele (REF). Male and female mice are shown with blue and pink symbols, respectively, and the numbers of mice are shown below. (D) μCT analysis of the proximal tibia of 5-month-old male mice revealed increased trabecular bone volume/tissue volume (BV/TV), decreased trabecular separation (Tb. S.), and increased trabecular number (Tb. N.) in compound heterozygous IduaD202E/indel mice (blue) compared to litter-matched control (Idua+/+, Idua+/D202E, and Idua+/indel pooled) mice (grey). Statistically significant differences were determined using 2-sided T-tests. (E,F) Mice homozygous for the ArsbI381N allele (VAR) developed shorter (E) tibia and (F) femur lengths compared to mice heterozygous for the allele (HET) or homozygous for the reference allele (REF). Male and female mice are shown with blue and pink symbols, respectively, and the numbers of mice are shown below. (G,H) Super-pedigree analysis combining two pedigrees segregating alleles in Arsb. Mice homozygous for the ENU alleles (VAR) developed reduced (G) tibia and (H) femur lengths compared to mice heterozygous for either allele (HET) and homozygous for the reference allele (REF). Male and female mice are shown with blue and pink symbols, respectively, and the numbers of mice are shown below. Data are median with interquartile range (IQR); whiskers extend up to 1.5x the IQR.

