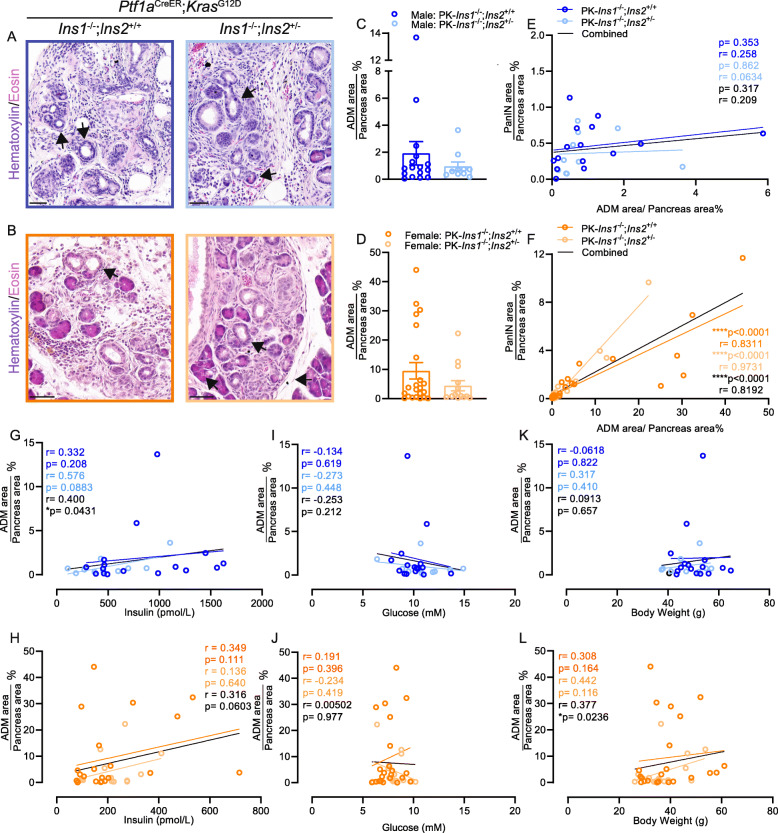
Fig. 3.
Altered ADM in mice with reduced hyperinsulinemia. A–B Representative high-magnification ADM (arrowheads) images of male (A) and female (B) PK-Ins1-/-;Ins2+/+ (left) and PK-Ins1-/-;Ins2+/- (right) mouse pancreas sections stained with H&E. Scale bars: 0.05 mm. C–D Quantification of percent of total pancreatic area occupied by ADM in male and female mice of each genotype (n = 10–22). Correlations of composite ADM area with PanIN area in non-tumor bearing (E–F), fasting insulin levels (G–H), fasting glucose (I–J), or body weight (K–L) in male (E, G, I, K) and female (F, H, J, L) PK-Ins1-/-;Ins2+/+ and PK-Ins1-/-;Ins2+/- mice (n = 10–16). Values are shown as mean ± SEM

