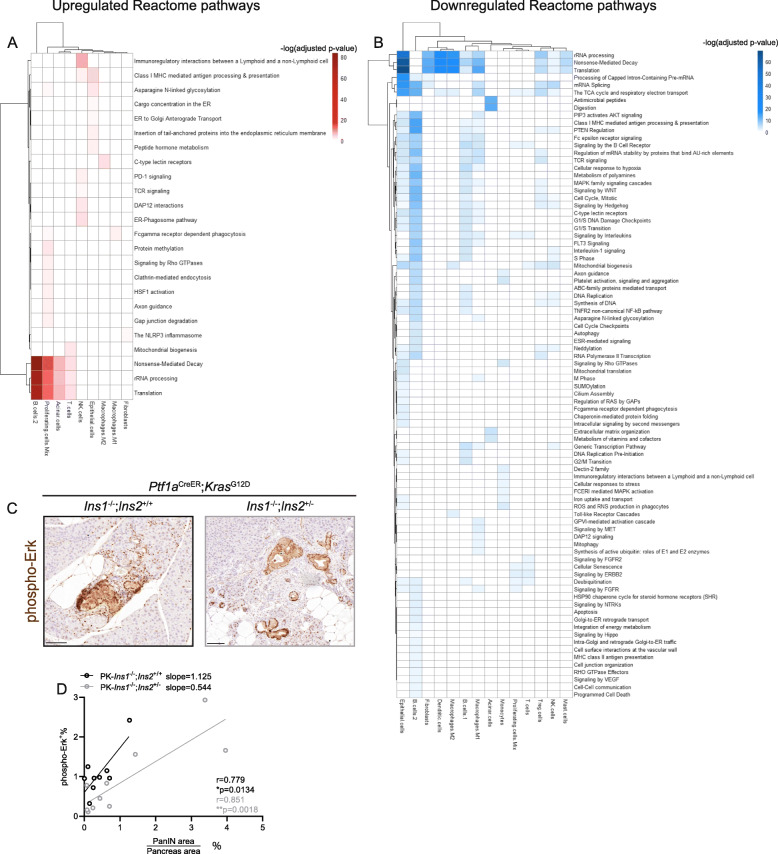
Fig. 6.
scRNAseq analysis reveals the pathways that are altered in each cell type by hyperinsulinemia. A Heatmap showing Reactome pathways that are upregulated in PK-Ins1-/-;Ins2+/- mice when compared with PK-Ins1-/-;Ins2+/+ mice for each cell type. The intensity of color indicates the negative log10 of adjusted p value. B Heatmap of Reactome pathways that are downregulated in PK-Ins1-/-;Ins2+/- mice when compared with PK-Ins1-/-;Ins2+/+ mice for each cell type. The intensity of color indicates the negative log10 of adjusted p value. C Immunohistochemistry of phospho-Erk for PK-Ins1-/-;Ins2+/+ and PK-Ins1-/-;Ins2+/- pancreata. Scale bars: 0.1 mm. D The correlation of composite PanINs area with phospho-Erk positive area. *p < 0.05, **p < 0.01

