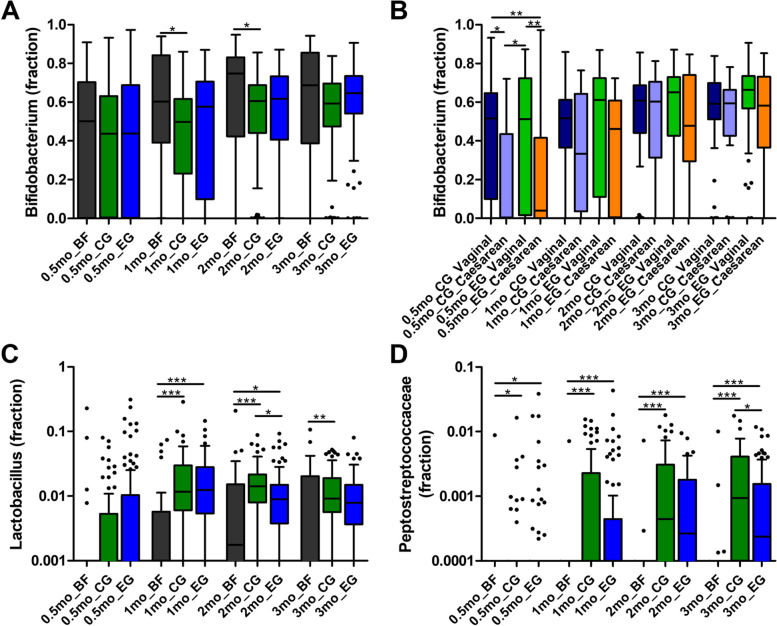
Fig. 4.
Relative abundance of a Bifidobacterium in the three feeding groups, b Bifidobacterium in the formula groups by delivery mode, c Lactobacillus and d Peptostreptococcaceae at baseline (≤ 0.5 months of age), 1, 2 and 3 months of age in the three feeding groups. BF, breastfed group; CG, control group; EG, experimental group. Groups were compared per time point by Kruskal–Wallis test, followed by pairwise comparisons with Dunn’s posthoc test. * = p < 0.05, ** = p < 0.01, *** = p < 0.001. Boxplots are displayed as Tukey whiskers. Sample size at each timepoint was: 71–81 in CG, 86–93 in EG and 25–29 in BF

