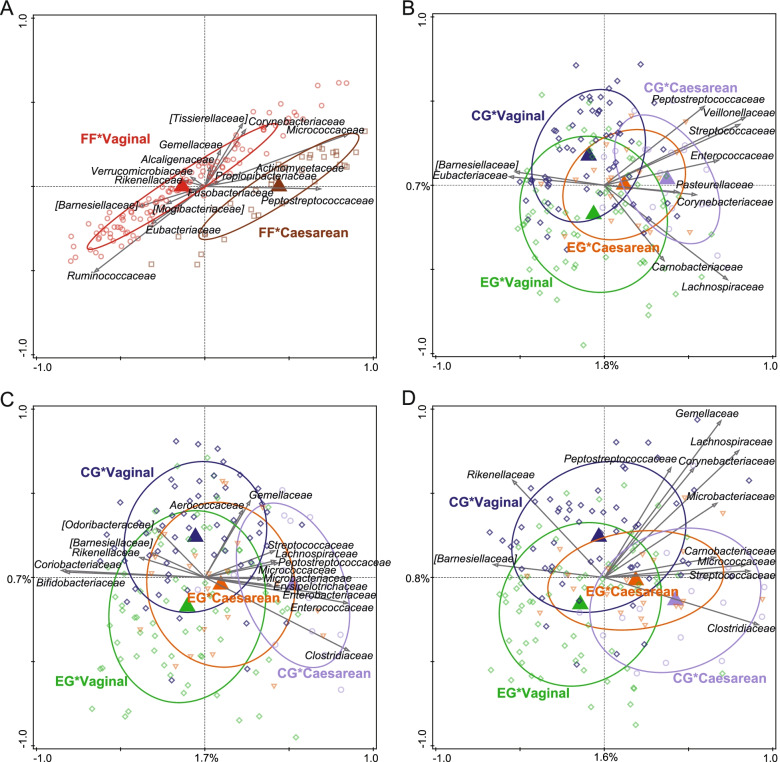
Fig. 6.
Comparison of the gut microbiota composition between the formula feeding groups at baseline, 1, 2 and 3 months of age stratified by delivery mode. CG, control group; EG, experimental group. Redundancy analysis on the OTU level at baseline, 1, 2 and 3 months of age stratified by delivery mode. OTUs were used as response data and feeding*delivery mode was explanatory data, the bacterial families that contributed most were plotted supplementary. The covariance attributed to “at least 1 episode of antibiotics treatment before the 3 months visit” (only at 3 months of age) was first fitted by regression and then “partialled out” (removed) from the ordination. The (unadjusted) variation explained is indicated on the axes. a Baseline (≤ 0.5 months of age). Variation explained by delivery mode was 2.7%, p = 0.002. b 1 month of age. Variation explained by feeding*delivery mode was 1.4%, p = 0.002. c 2 months of age. Variation explained by feeding*delivery mode was 1.2%, p = 0.002. d 3 months of age. Variation explained by feeding*delivery mode was 1.2%, p = 0.002. Sample size at each timepoint was: 71–81 in CG and 86–93 in EG

