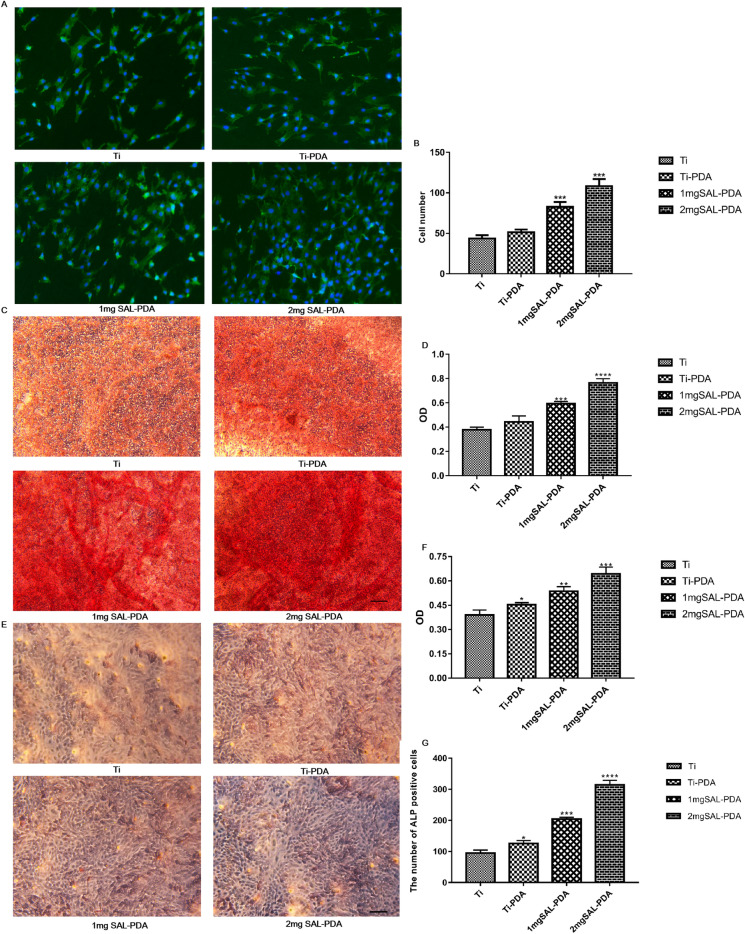
Fig. 3.
Osteogenesis of MC3T3-E1 cells cultured in different coatings in vitro. A Phalloidin and DAPI staining on the 5th day. Microscope magnification was ×200. Scale bar = 100 μm. B Numbers of stained cells. C Alizarin Red staining on the 28th day. D Quantitative results of Alizarin Red staining. E ALP staining of MC3T3-E1 cells on the 5th day. F ALP content in supernatant of each coating group. G The number of ALP positive cells. Microscope magnification was ×100. Scale bar = 200 μm. *P < 0.05, **P < 0.01, ***P < 0.001 and ****P < 0.0001 were obtained by comparison with uncoated Ti

