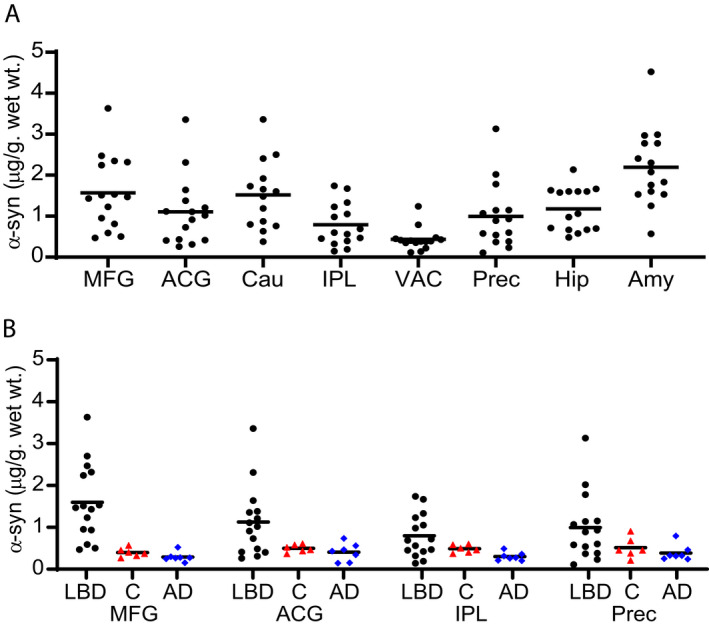
Figure 1.

Regional distribution of insoluble α‐syn concentration in LBD and Control cases (Syn1‐13G5B ELISA). Levels of insoluble α‐syn were measured by sandwich ELISA in eight brain regions from LBD (black circles) cases (A) and four brain regions from control (red triangles) and AD (blue diamonds) cases (B). There was a wide range of α‐syn accumulation among LBD cases, including some cases in which α‐syn accumulation overlapped with levels measured in control cases. The highest median levels of α‐syn deposition were in MFG, caudate, and amygdala. Control and AD cases had low levels of insoluble α‐syn in all brain regions tested. The lower limit of quantification (LLQ) for the ELISA was 0.15 ng/mL or 0.05 µg/g wet wt tissue. All samples were in the quantifiable range. The α‐syn level in MFG was significantly higher in LBD compared with control cases. Data were analyzed with the two‐tailed Mann–Whitney test using a significance level of 0.05 and corrected for multiple comparisons with the Holm‐Bonferroni method. 52 Mid‐Frontal Gyrus (MFG), Anterior Cingulate Gyrus (ACG), Caudate (Cau), Inferior Parietal Lobule (IPL), Visual Association cortex (VAC), Precuneus (Prec), Hippocampus (Hip), and Amygdala (Amy).
