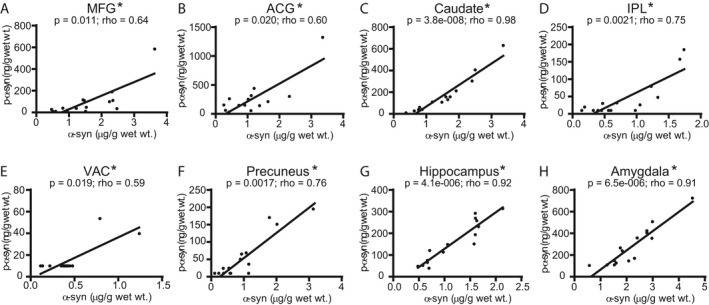
Figure 3.

Correlations between insoluble α‐syn (Syn1‐13G5B ELISA) and p‐α‐syn (pSyn/81A‐Syn1B ELISA) concentration measurements in LBD cases. We observed significant correlations (Spearman) between α‐syn and p‐α‐syn in all eight brain regions: (A) MFG, (B) ACG, (C) caudate, (D) IPL, (E) VAC, (F) precuneus, (G) hippocampus, (H) amygdala, with the strongest correlations (Spearman rho values > 0.9) in caudate, hippocampus, and amygdala. Data were corrected for multiple comparisons with the Holm‐Bonferroni method. 52 Lines were generated by linear regression.
