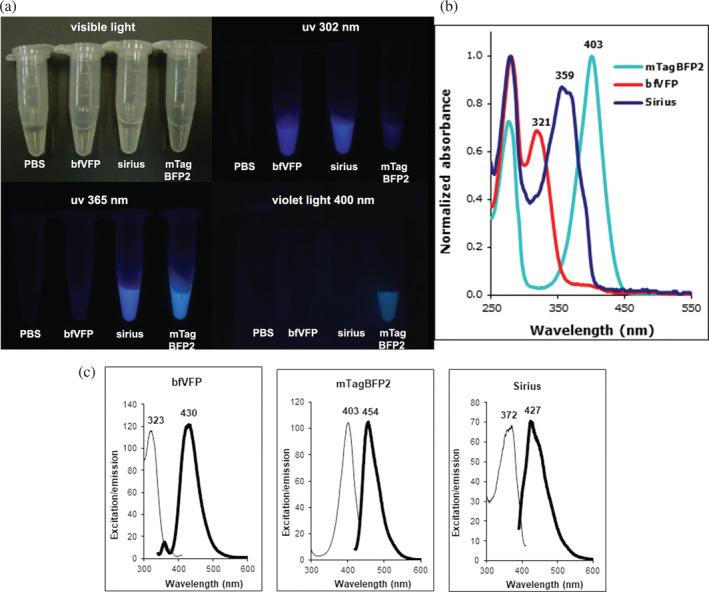
FIGURE 2.

bfVFP compared with two other blue fluorescent proteins: Sirius and mTagBFP2. (a) Visualization of the pure proteins at 1 mg/ml under irradiation at different lights. (b) UV–Vis absorbance of the three BFPs. (c) Excitation and emission spectra of the three BFPs
