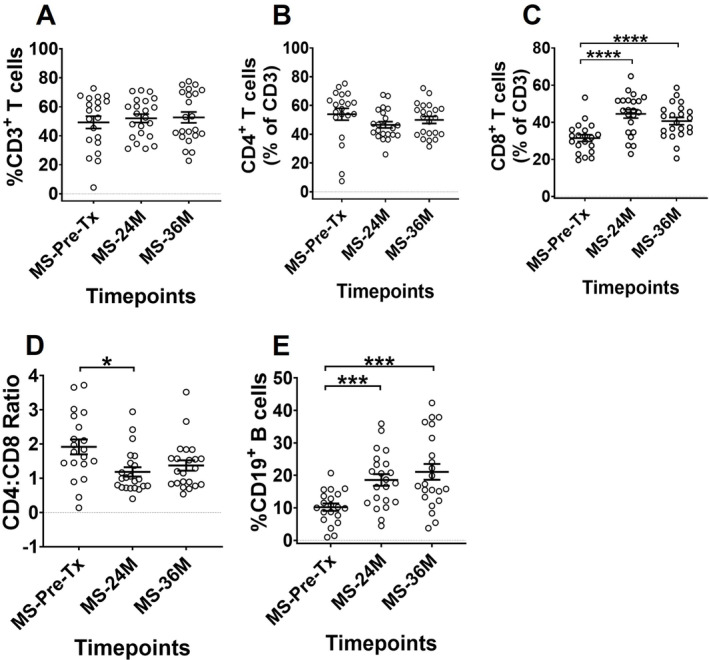
Figure 1.

Comparison of lymphocyte reconstitution between pre‐AHSCT and post‐AHSCT timepoints in MS patients. The frequencies of (A) CD3+ T cells, (B) CD4+ T cells, (C) CD8+ T cells, (D) CD4:CD8 ratio and (E) CD19+ B cells. The frequencies in graphs (A) and (E) are shown as percentage of live lymphocytes, and (B) and (C) as percentage of CD3+. Gating strategy can be obtained in Figure S1. Statistical analysis was performed using linear mixed‐effects model (p < 0.05) and multiple comparisons adjusted using Holm‐Sidak method. Logarithmic transformations were performed for analysing difference between pre‐AHSCT and post‐AHSCT timepoint in CD4:CD8 ratio. Pre‐AHSCT (Pre‐Tx) n = 20, 24 months (24M) n = 22, 36 months (36M) n = 22. *p < 0.05, **p < 0.01, ***p < 0.001, ****p < 0.0001. Black bars and asterisks indicate longitudinal comparison between pre‐ and post‐AHSCT timepoints within MS cohort.
