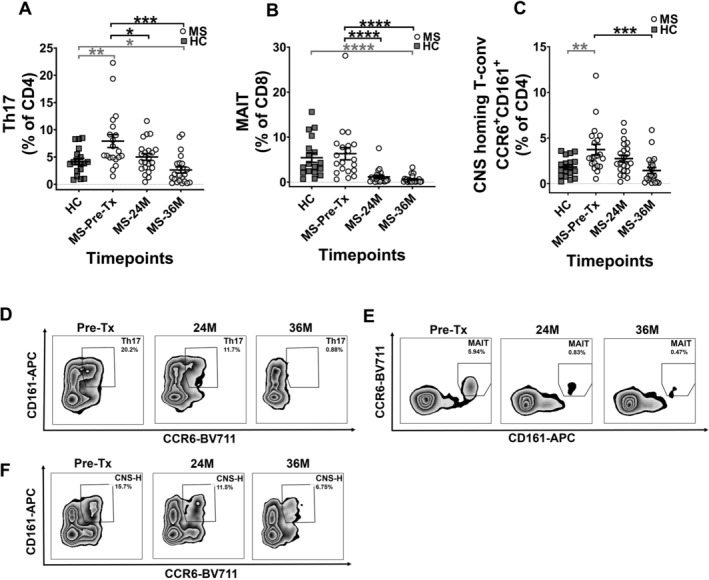
Figure 2.

Decrease in frequency of pro‐inflammatory immune subsets in MS patients. The frequencies of (A) Th17, (B) MAIT and (C) CNS‐homing T‐conventional (T‐conv) cells. The frequencies in graphs (A) and (C) are shown as percentage of CD4+, and (B) as percentage of CD8+. Representative flow cytometry plots for subsets at each timepoint are shown in (D–F). (D) Zebra plots showing Th17 subset, with numbers on the plots indicating memory Th17 percentage gated from CD45RA− parent population. (E) Zebra plots showing MAIT subset, with numbers on the plots indicating MAIT cell percentage gated from CD8+ parent population. (F) Zebra plots showing CNS‐homing T‐conv subset (CNS‐H), with numbers on the plots indicating CNS‐H subset percentage gated from CD49d+β7− T‐conv cells parent population. Gating strategy can be obtained in Figure S1. Statistical analysis was performed using linear mixed‐effects model (p < 0.05) and multiple comparisons adjusted using Holm‐Sidak method. Logarithmic transformations were performed for analysing difference between pre‐AHSCT and post‐AHSCT timepoint in Th17, MAIT and CNS‐homing T‐conv cell populations. Statistical analysis between MS at pre‐/36M post‐AHSCT and HCs was performed using independent two‐sample t‐tests (p < 0.05). As normality assumption failed for Th17, MAIT and CNS‐homing populations in MS cohort at 36M post‐AHSCT, Mann–Whitney U test was used to compare between MS at 36M pre‐AHSCT against HCs for these subsets. MS Pre‐AHSCT (Pre‐Tx) n = 20, 24 months (24M) n = 22, 36 months (36M) n = 22, HCs n = 18. *p < 0.05, **p < 0.01, ***p < 0.001, ****p < 0.0001. Grey bars and asterisks indicate cross‐sectional comparison between MS at pre‐/36M post‐AHSCT and HC cohorts, whereas black bars and asterisks indicate longitudinal comparison between pre‐ and post‐AHSCT timepoints within MS cohort.
