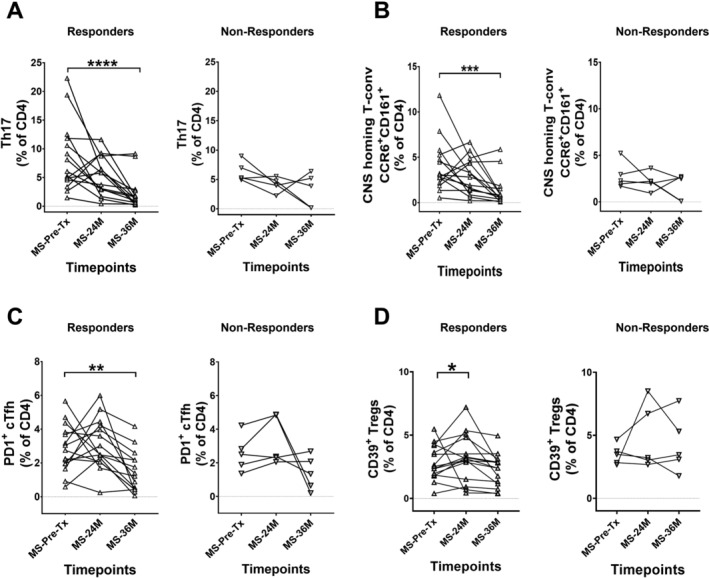
Figure 5.

AHSCT‐induced changes in key immune subsets are associated with clinical response in MS patients. The MS patient cohort was split into responders (▵) and non‐responders (▽) based on clinical relapse and MRI activity. The frequencies of (A) Th17 cells in responders and non‐responders, (B) CNS‐homing populations in responders and non‐responders, (C) PD1+ cTfh in responders and non‐responders and (D) CD39+ Tregs in responders and non‐responders. Statistical analysis was performed using parametric Friedman’s ANOVA with Dunn’s test (p < 0.05). Linear mixed‐effects model was not used for this analysis due to smaller sample size in non‐responder group. As the Friedman’s ANOVA analyses complete datasets, two patients from responder group that had missing timepoints were excluded for statistical comparisons. In responder group, pre‐AHSCT (Pre‐Tx) n = 15, 24 months (24M) n = 15, 36 months (36M) n = 15. In non‐responder group, pre‐AHSCT (Pre‐Tx) n = 5, 24 months (24M) n = 5, 36 months (36M) n = 5. **p < 0.01, ****p < 0.0001. Black bars and asterisks indicate longitudinal comparison within responder and non‐responder patient subgroups in MS cohort.
