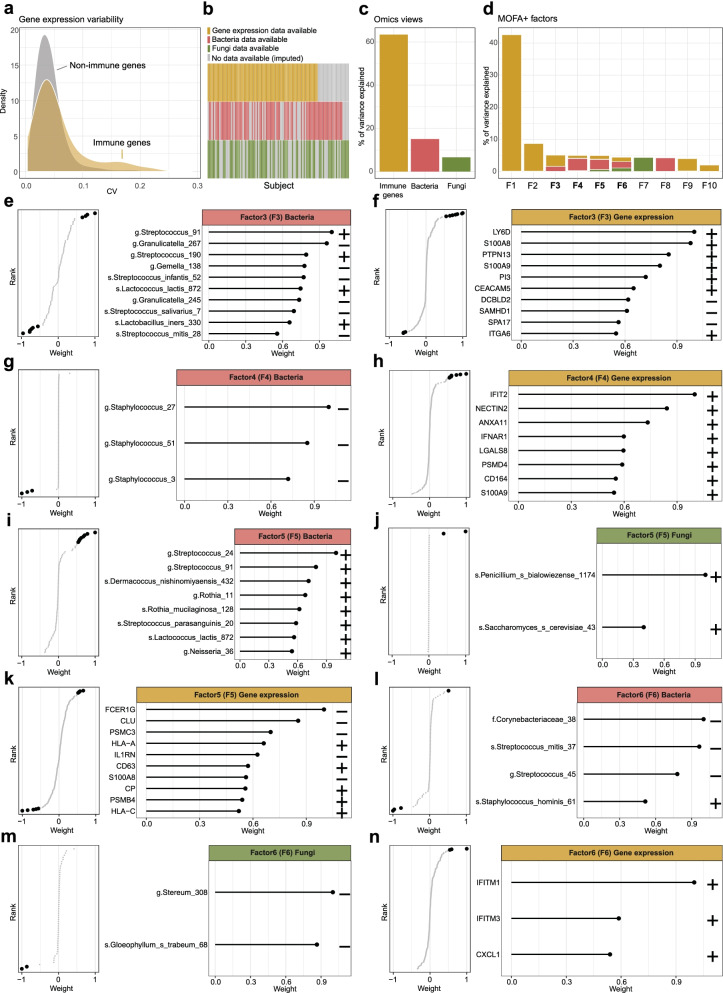
Fig. 5.
Multi-Omics Factor Analysis (MOFA+) of host immune gene expression and microbiota in the nasal cavity. a Gene expression coefficient of variation (CV) of immune (grey) versus non-immune (yellow) protein coding genes. b Dataset availability per subject (columns) and omics modality (rows). Unavailable datasets (no sample collected or failed QC) are highlighted in grey. c Cumulative proportion of variance explained (R2) by each omics modality. d Percentage of variation explained by each factor across the different omics modalities. Factors with more than 2 omics modalities are highlighted in bold. e–n Loadings of the ASVs and/or genes with the largest weights for a given factor. Yellow color relates to immune genes, red to bacteria and green to fungi. Sample size for MOFA+ analysis is n = 109 subjects

