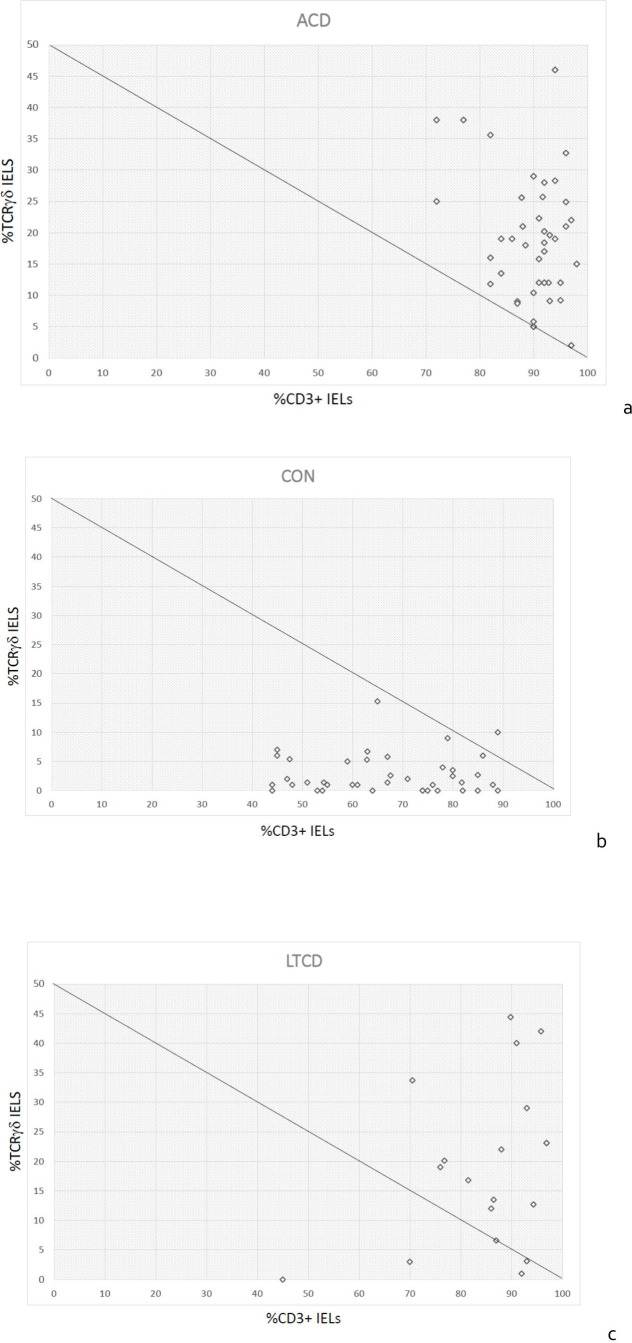
Figure 2.
Scatter plots of %CD3+ intraepithelial lymphocytes (IELs) as a proportion of all CD45+ lymphocytes (x-axis) charted against %TCRγδ+ IELs as a proportion of CD3+ IELs (y-axis), showing the discriminant function (%CD3+ IELs+2x(%TCRγδ+IELs)) as a line. (A) Active coeliac disease (ACD), (B) control (CON), (C) long-term coeliac disease on diet (LTCD). TCRγδ, T-cell receptor γδ.

