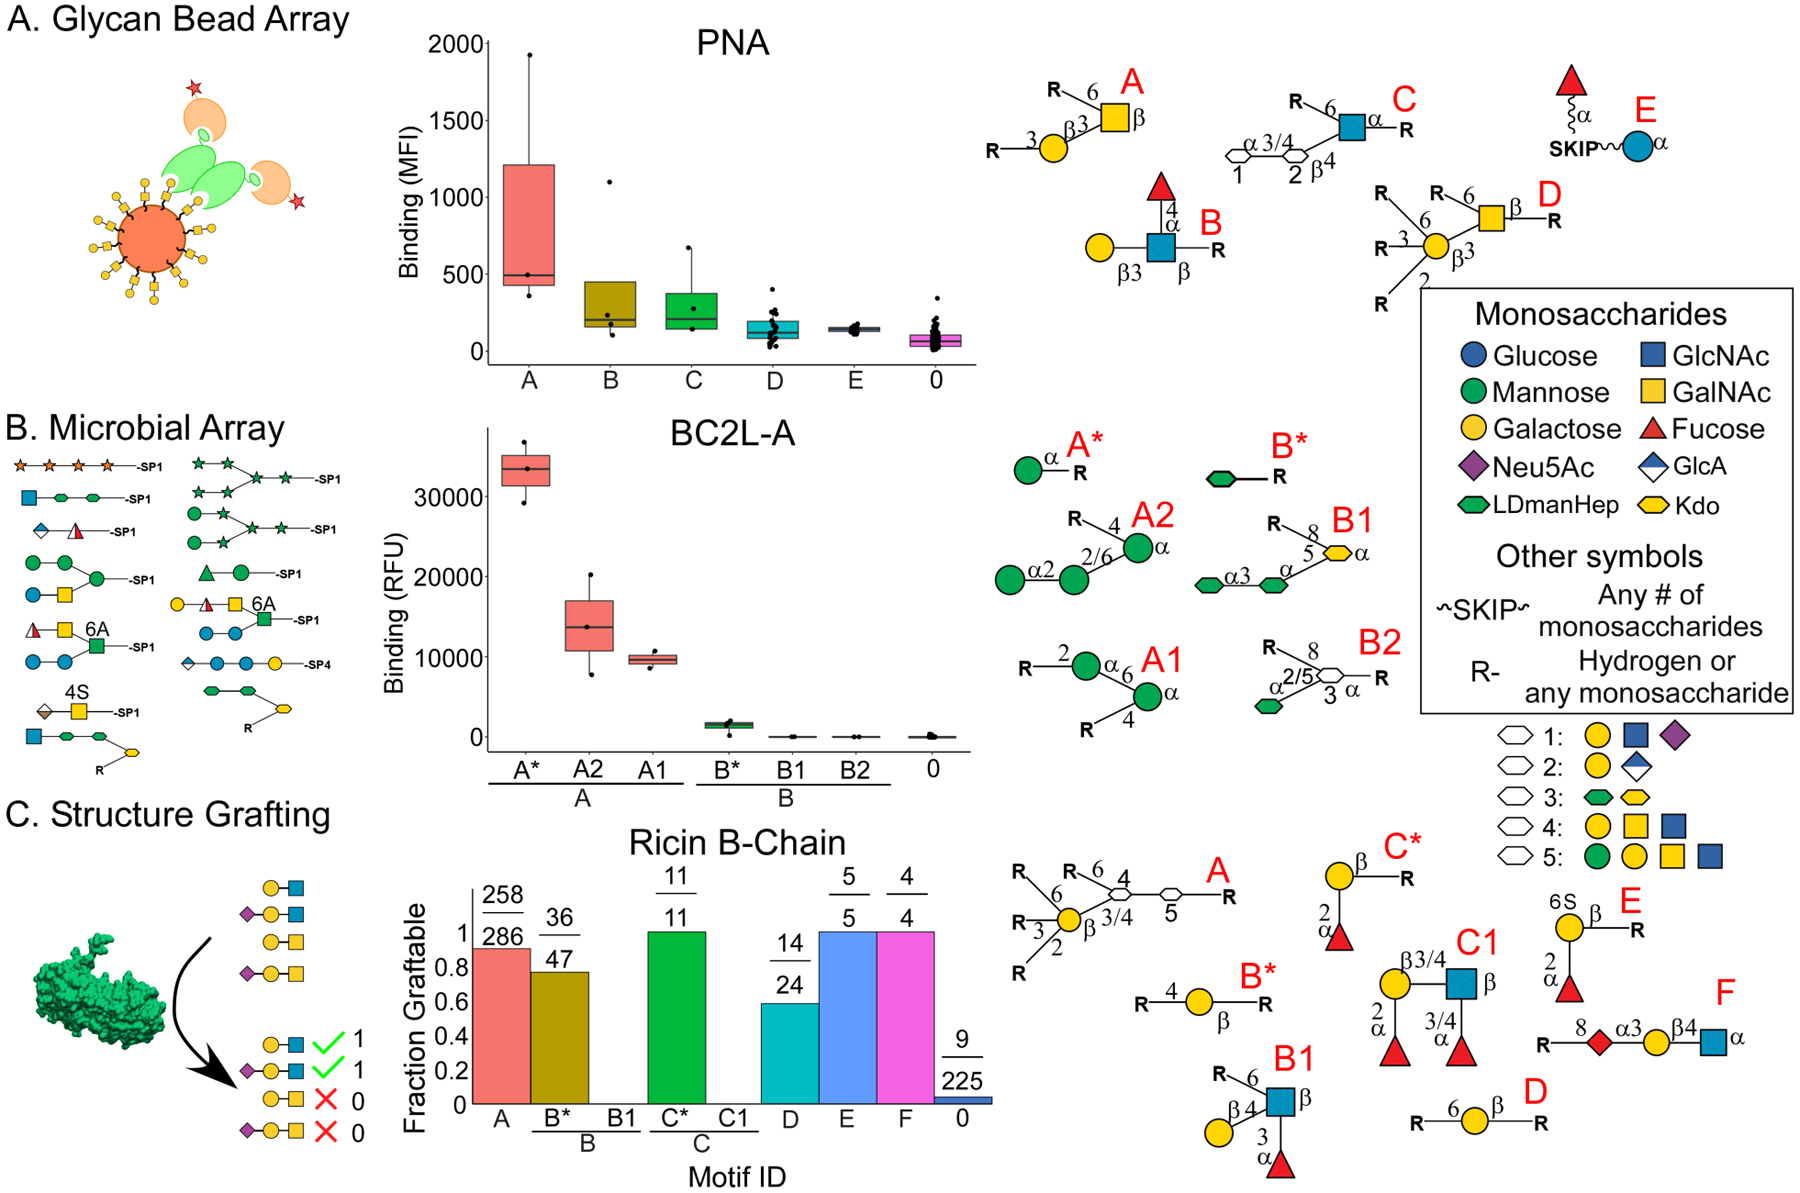
Figure 2. Analysis of Data from Divergent Platforms.

The graphs show the intensities of binding to the glycans grouped according to their motifs, which are presented graphically at right. The units of binding vary between the methods. A. The bead array uses mean fluorescence intensity (MFI). B. The microbial array uses relative fluorescence units (RFU). C. Structure grafting denotes compatible and incompatible glycans respectively with a 1 or 0.
