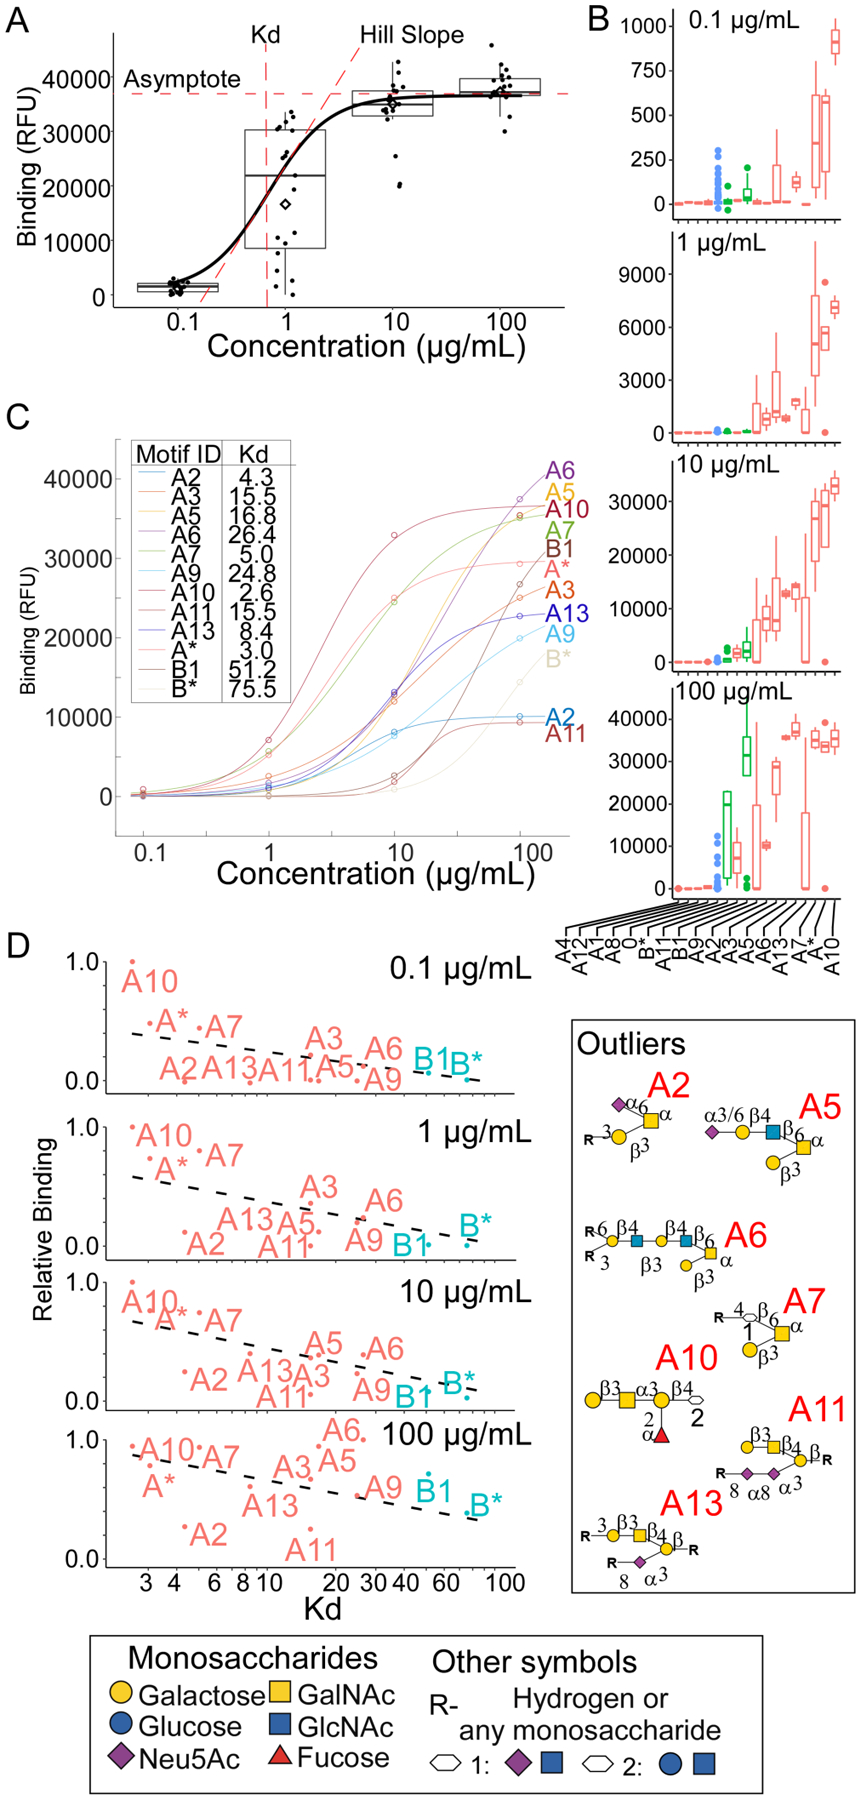
Figure 3. Combined Analysis of Datasets with Varied Protein Concentrations.

A. The fit of the logistic curve across concentrations provides the asymptote, slope, and half-maximum binding for each motif, the latter approximating the Kd. B. The simultaneous analysis of data for PNA over multiple concentrations gave the average binding to each motif at each concentration. C. The logistic curves fit to the average binding for each motif revealed distinct binding profiles across motifs. D. The relative binding (motif binding normalized to the highest motif binding) was plotted with respect to the curve-derived Kd values.
