
Fig. 4.
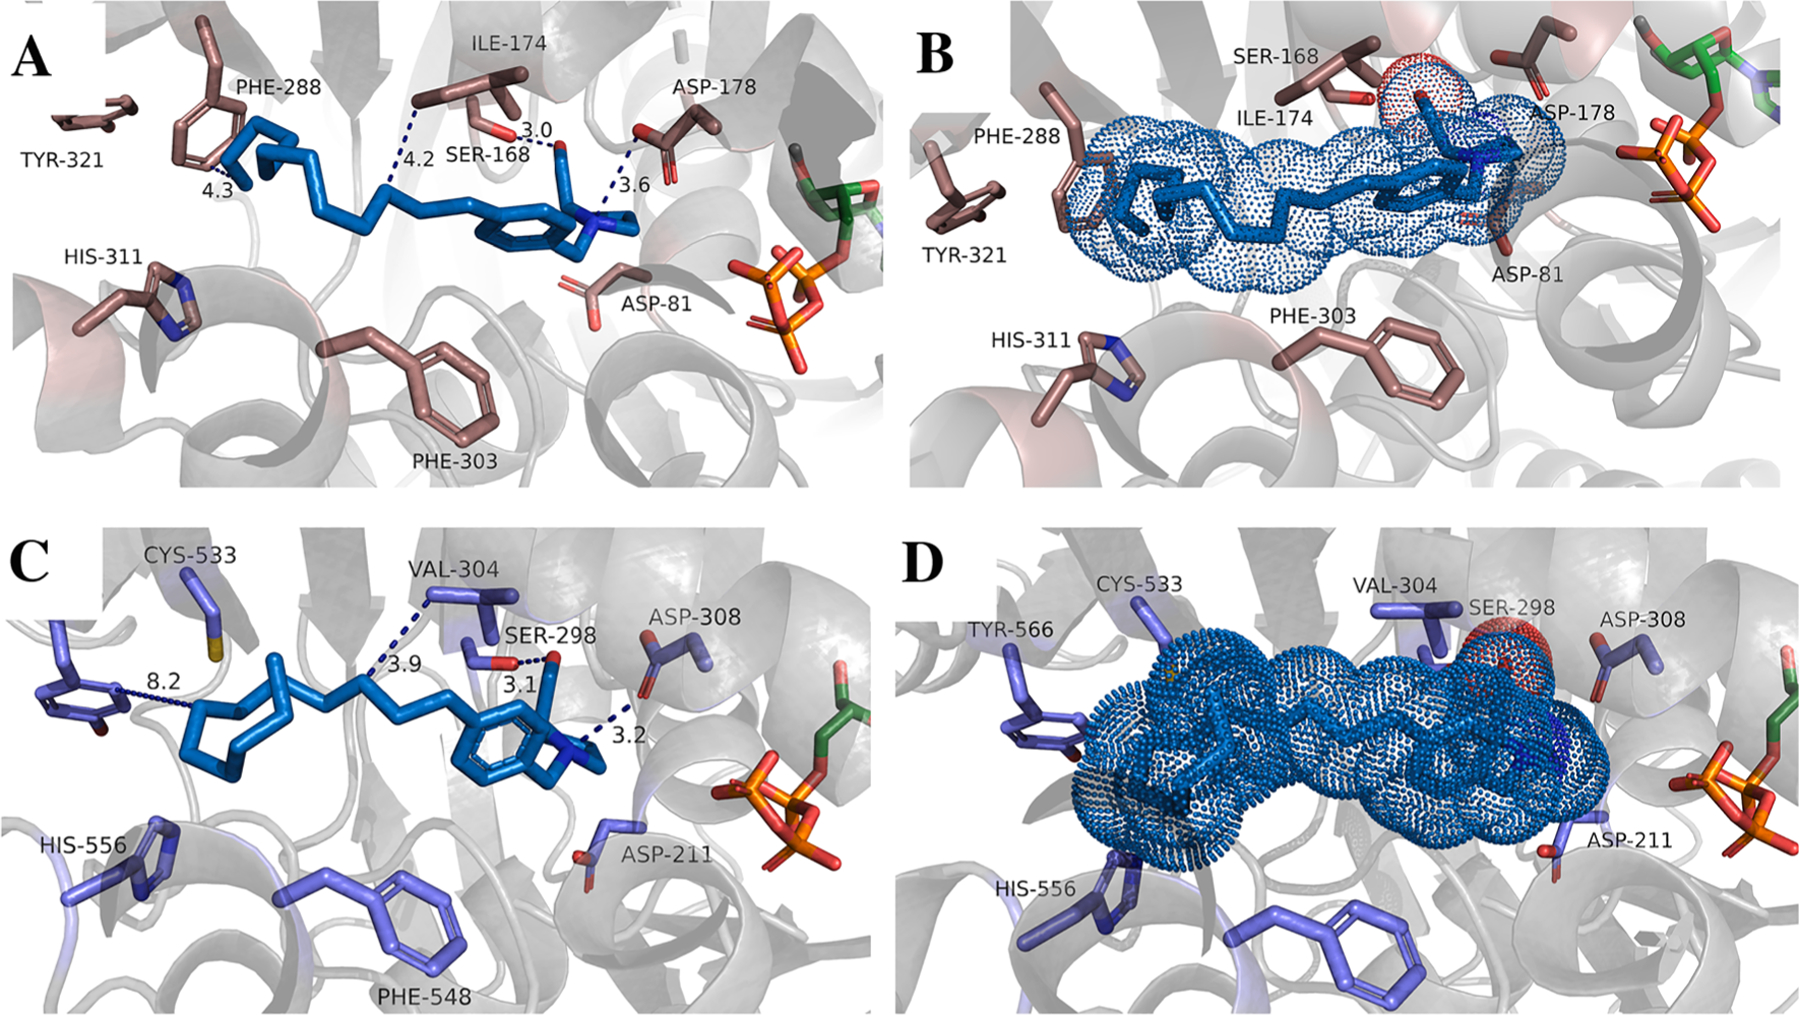
Docking of inhibitor 22d into hSphK1 (A, B) and hSphK2 (C, D). Key residues in the binding pocket are represented by grey sticks and are labeled. ATP is shown in orange and colored by element. The SphK1 and SphK2 protein structures are depicted in grey cartoon. Distances between interacting atoms are shown as dashed lines. Inhibitors are shown as stick and colored by element. Panels B and D illustrate the inhibitor as Van der Waals radii in dots to represent volume occupancy of the inhibitor.