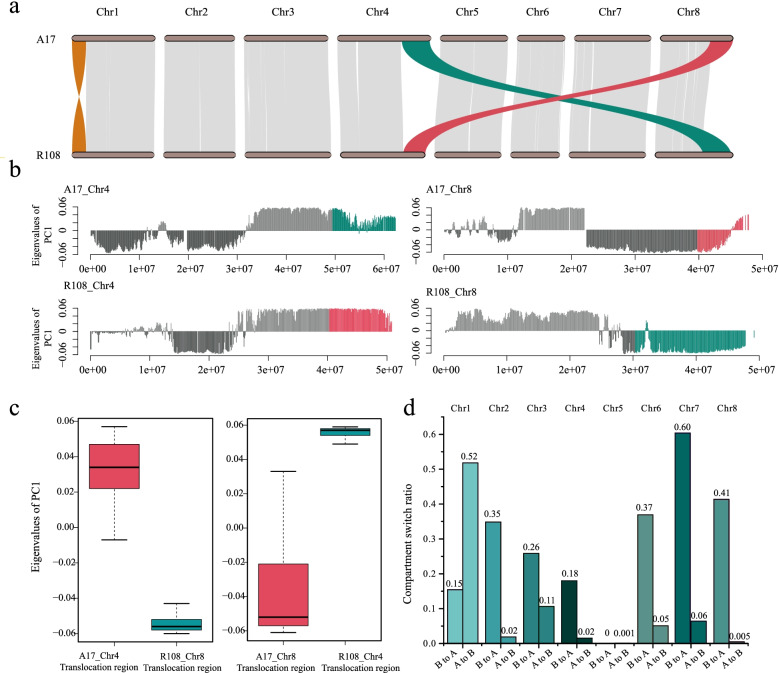
Fig. 2.
Gene synteny and comparative compartmental analysis between A17 and R108. A Gene synteny between the A17 and R108 genomes. B Compartment status in chromosomes 4 and 8 of the A17 and R108 genomes. The positive values in the first eigenvector represent compartment A and the negative values represent compartment B. The colors represent inter-chromosomal reciprocal translocations. C Boxplot showing the A/B compartment status of the translocation regions. D Bar graph showing compartmental status switches (i.e., A to B, and B to A) across the eight chromosomes in R108 using the compartmental status of the corresponding syntenic regions in A17 as a reference

