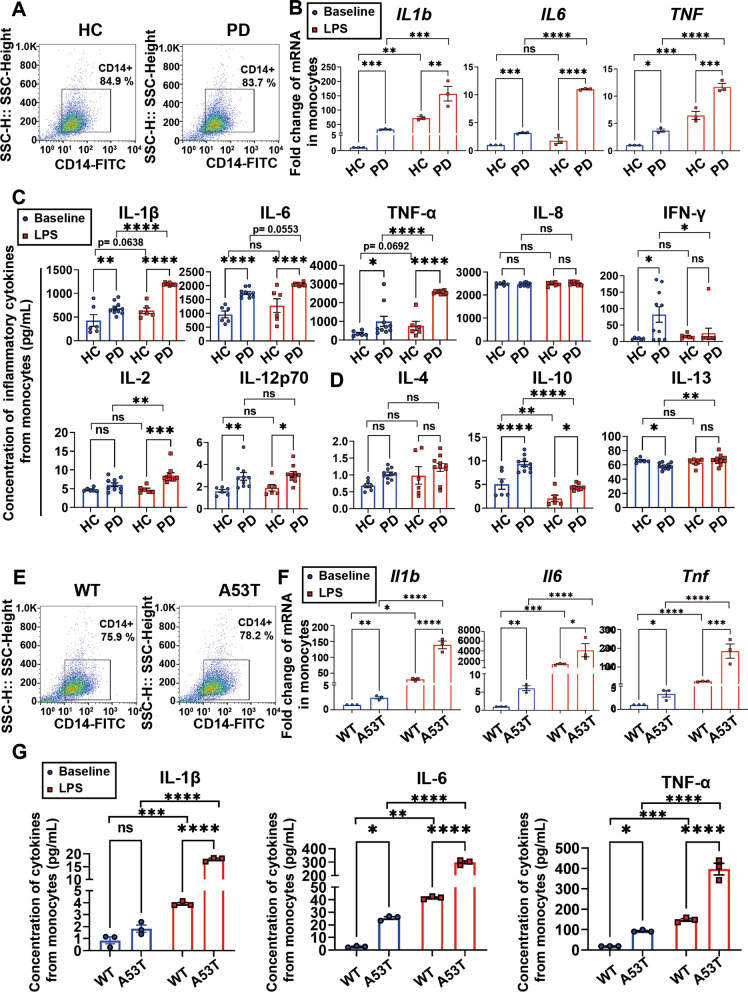
Fig. 1.
Characterization of monocytes in PD patients and mice. A Purity of monocytes isolated from PD patients and healthy controls were evaluated by flow cytometry. The monocytes were labelled with CD14-FITC. B Quantitative analysis of IL1b, IL6 and TNF mRNA levels using qPCR, in human monocytes at resting state (blue) and stimulated with LPS for 24 h (red). N = 3 independent pooled human samples in each group. C Quantitative analysis of pro-inflammatory cytokines IL-1β, IL-6, TNF-α, IL-8, IFN-γ, IL-2, and IL-12p70, and D anti-inflammatory cytokines IL-4, IL-10, and IL-13 using MSD, released by human monocytes at resting state (blue) and stimulated with LPS for 24 h (red). N = 6 independent human samples in healthy control group and N = 10 independent human samples in PD group. E Purity of monocytes isolated from A53T mice and WT mice were evaluated by flow cytometry. The monocytes were labelled with CD14-FITC. F Quantitative analysis of Il1b, Il6 and Tnf mRNA levels using qPCR, in mouse monocytes at resting state (blue) and stimulated with LPS for 24 h (red). N = 3 pooled independent animals in each group. G Quantitative analysis of cytokines IL-1β, TNF-α and IL-6 using ELISA, released by mouse monocytes at resting state (blue) and stimulated with LPS for 24 h (red). N = 3 pooled independent animals in each group. Values are means ± S.E.M, two-way ANOVA with Bonferroni’s post hoc test. *, P < 0.05; **, P < 0.01; ***, P < 0.001; ****, P < 0.0001

