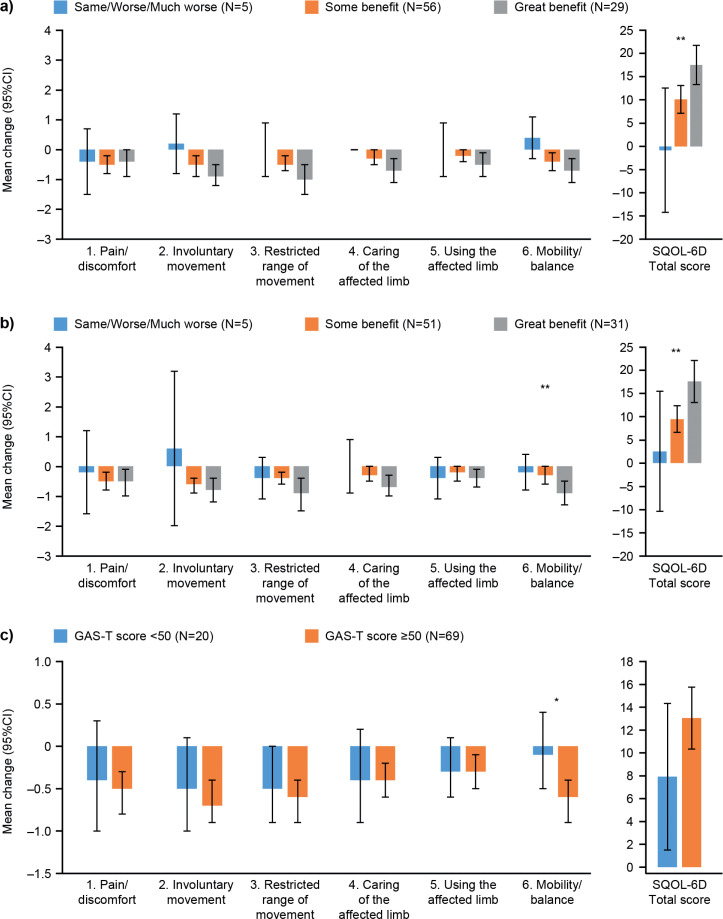
Fig. 3.
Mean (95% CI) change in Spasticity Quality of Life-6 Dimensions instrument (SQoL-6D) scores by subgroups at follow-up. (a) Clinician Global Assessment of Benefit scale. (b) Patient Global Assessment of Benefit scale. (c) GAS T-scores. Data are derived from the Responsiveness Population (n = 90).*p < 0.05 **p < 0.01. Analysis of variance (ANOVA) was used for the Total score, Kruskal–Wallis for dimension scores and t-tests for GAS T-scores. Note: Parametric and non-parametric tests led to similar p-values. 95% CI: 95% confidence interval; GAS: goal attainment scaling.

