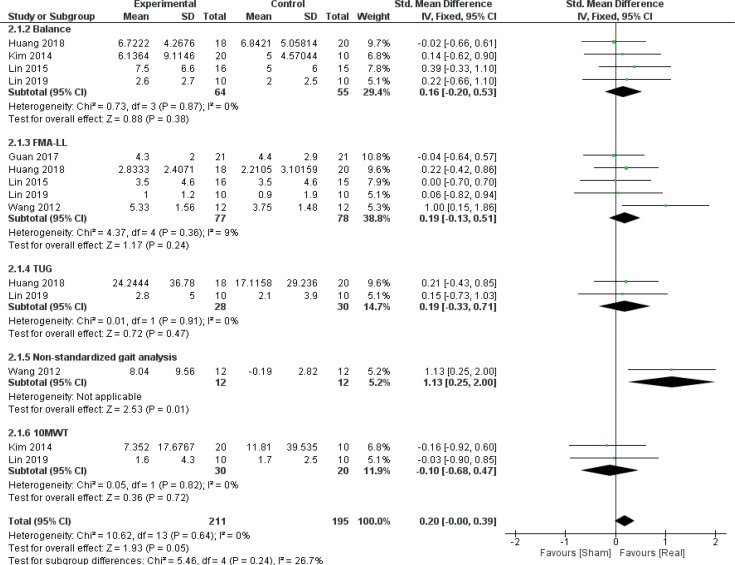
Fig. 8.
Forest plot of comparison: disorder type – stroke. 10MWT: 10-metre walking test: Change in gait speed (reduction in time-to-complete, s). Balance: change in test scores (BBS, PASS). FMA-LL: Fugl-Meyer Assessment Scale Lower limb sub-scores: change in scores. Non-standardized gait analysis: reduction in time-to-complete. TUG: Timed Up-and-Go test: reduction in time to complete (s). 95% CI: 95% confidence interval; SD: standard deviation (34, 36, 40, 42, 43, 49).

