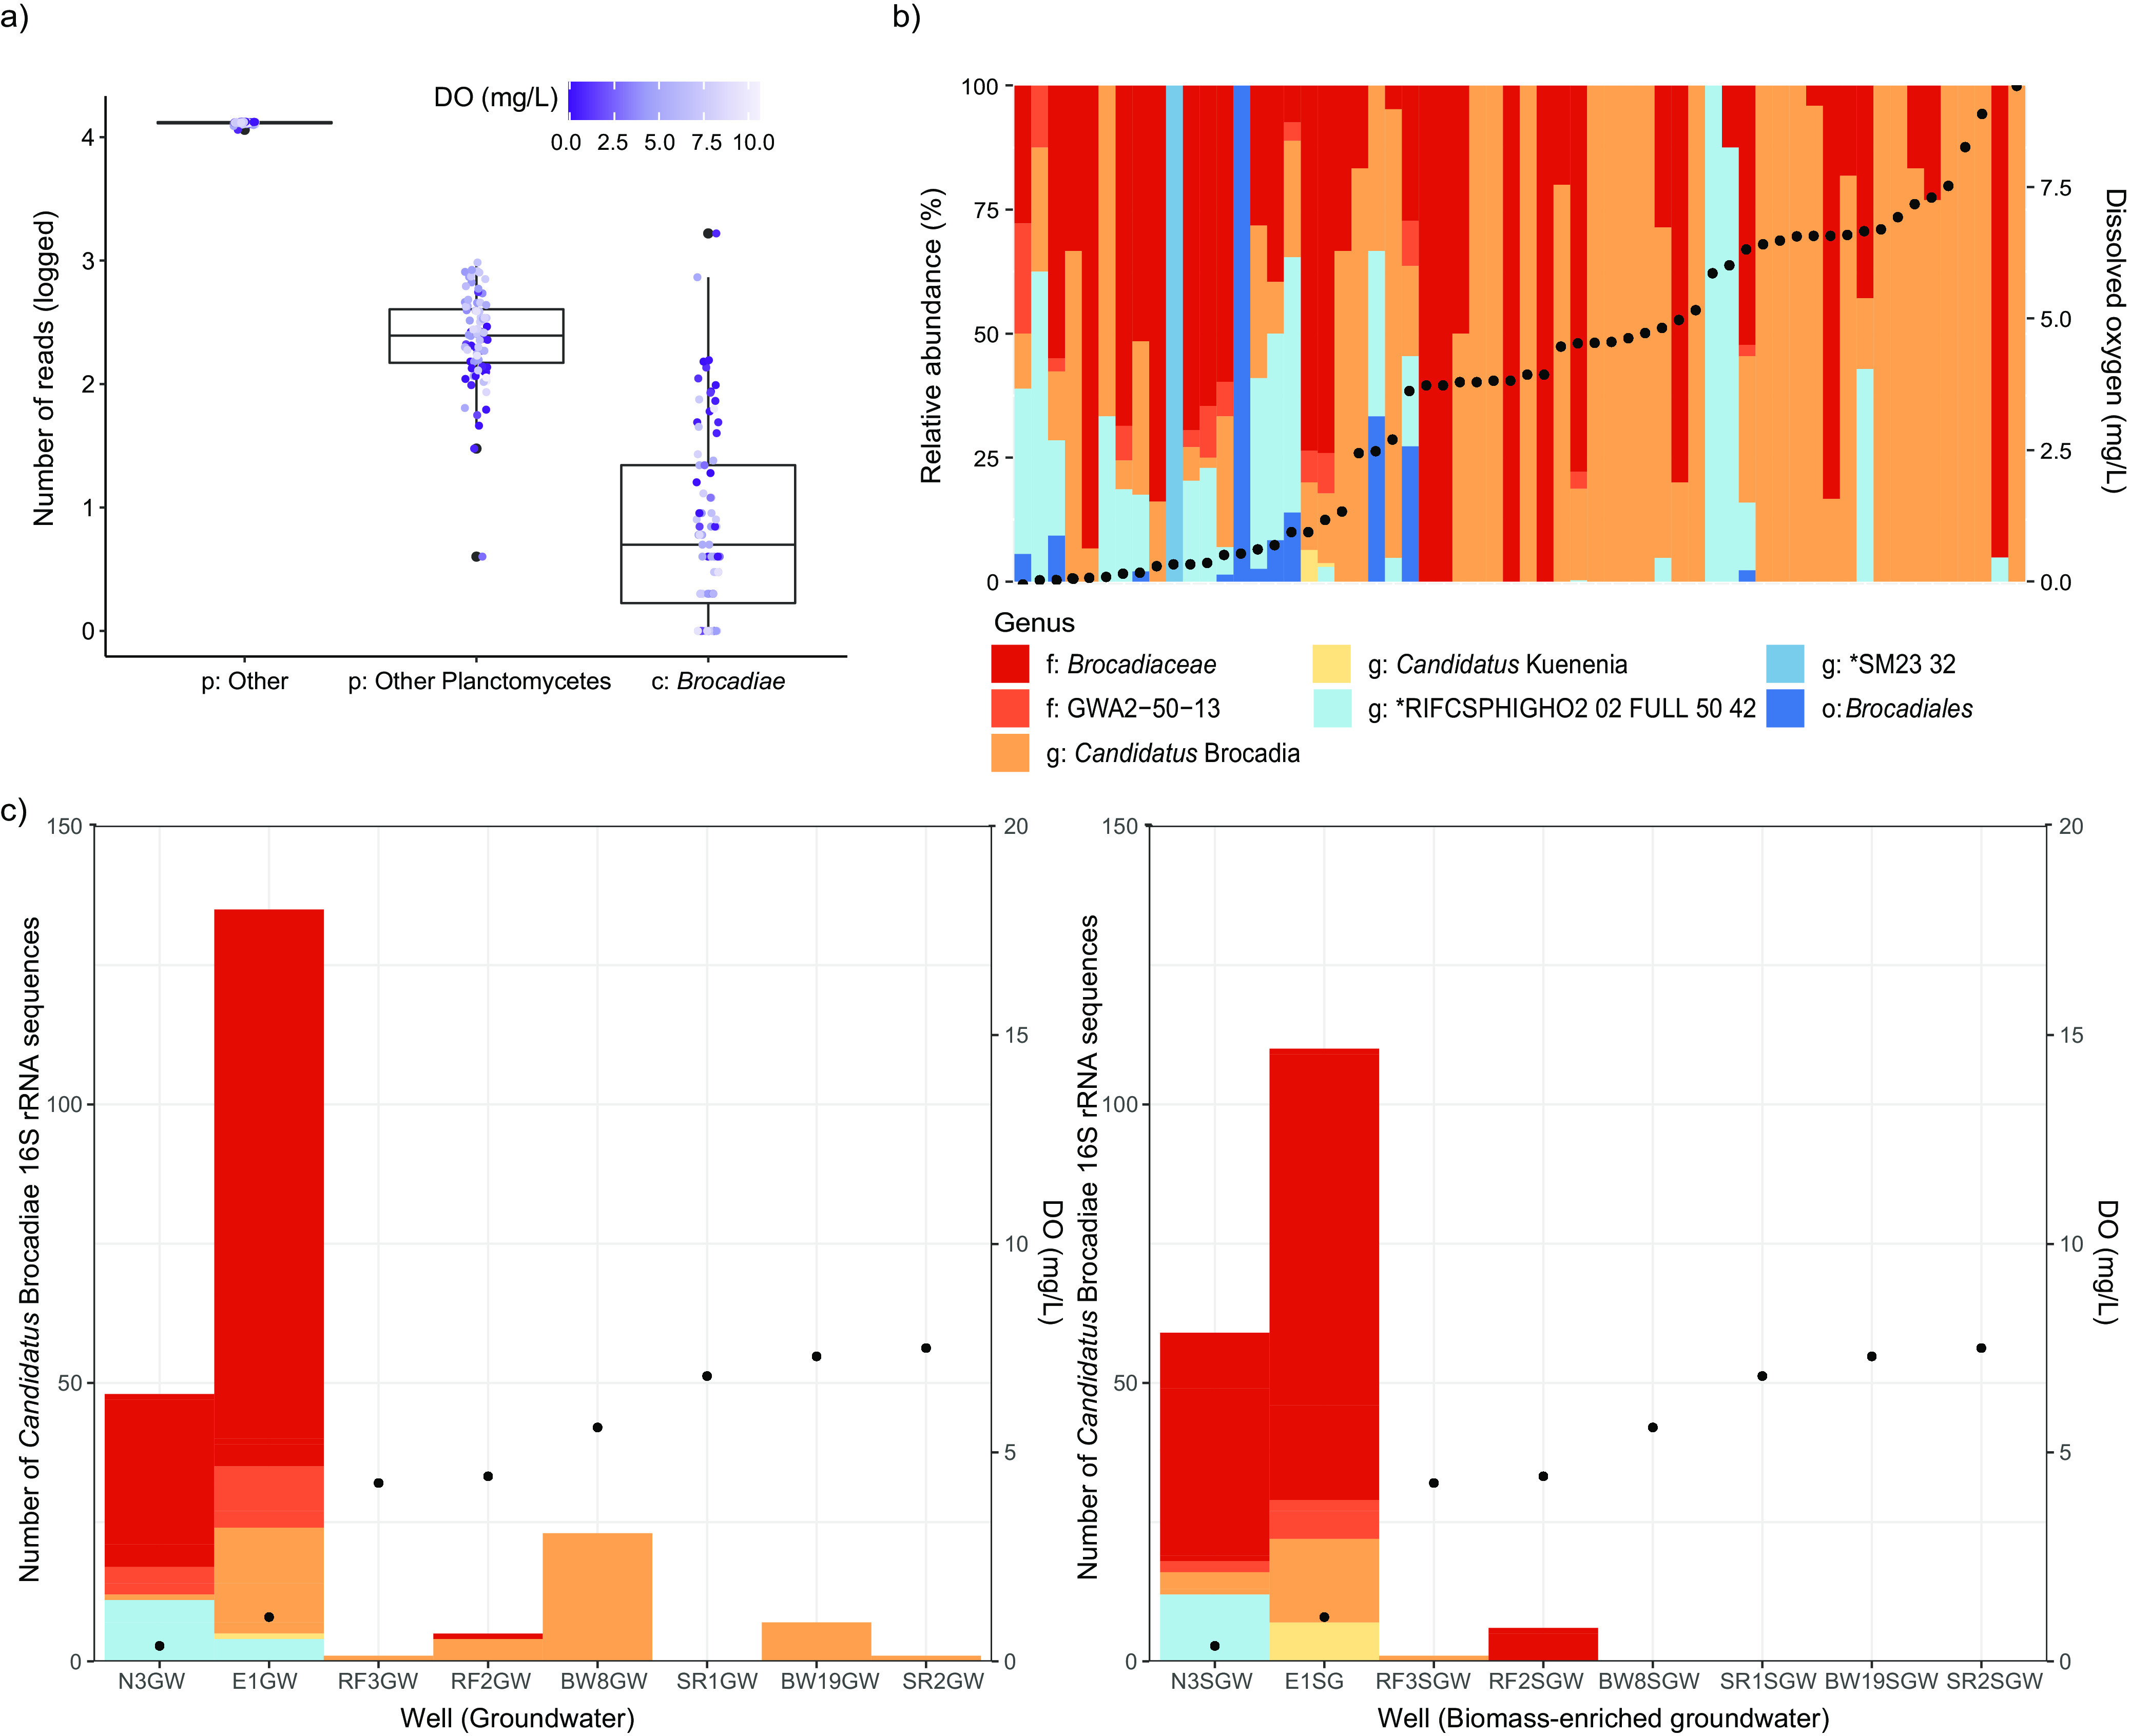
FIG 1.

Box plot and stacked bar graphs showing the prevalence, relative abundance, and diversity of anammox bacteria (“Ca. Brocadiae”), based on 16S rRNA gene amplicon data. (a) Number of OTUs identified as “Ca. Brocadiae” relative to other bacteria (p:Other) and non-anammox Planctomycetes (p:Other Planctomycetes) across 80 samples. The horizontal line represents the median number of OTUs present. (b) Structure of the anammox bacterial community observed in 60 samples where “Ca. Brocadiae” were identified, ordered by DO concentration. (c) Structure of the anammox bacterial community observed in groundwater (left) and biomass-enriched groundwater (right), ordered by groundwater DO concentration. Black points show DO content. Bars represent different genera within the class “Ca. Brocadiae.” g, genus; f, family; o, order; c, class; p, phylum.
