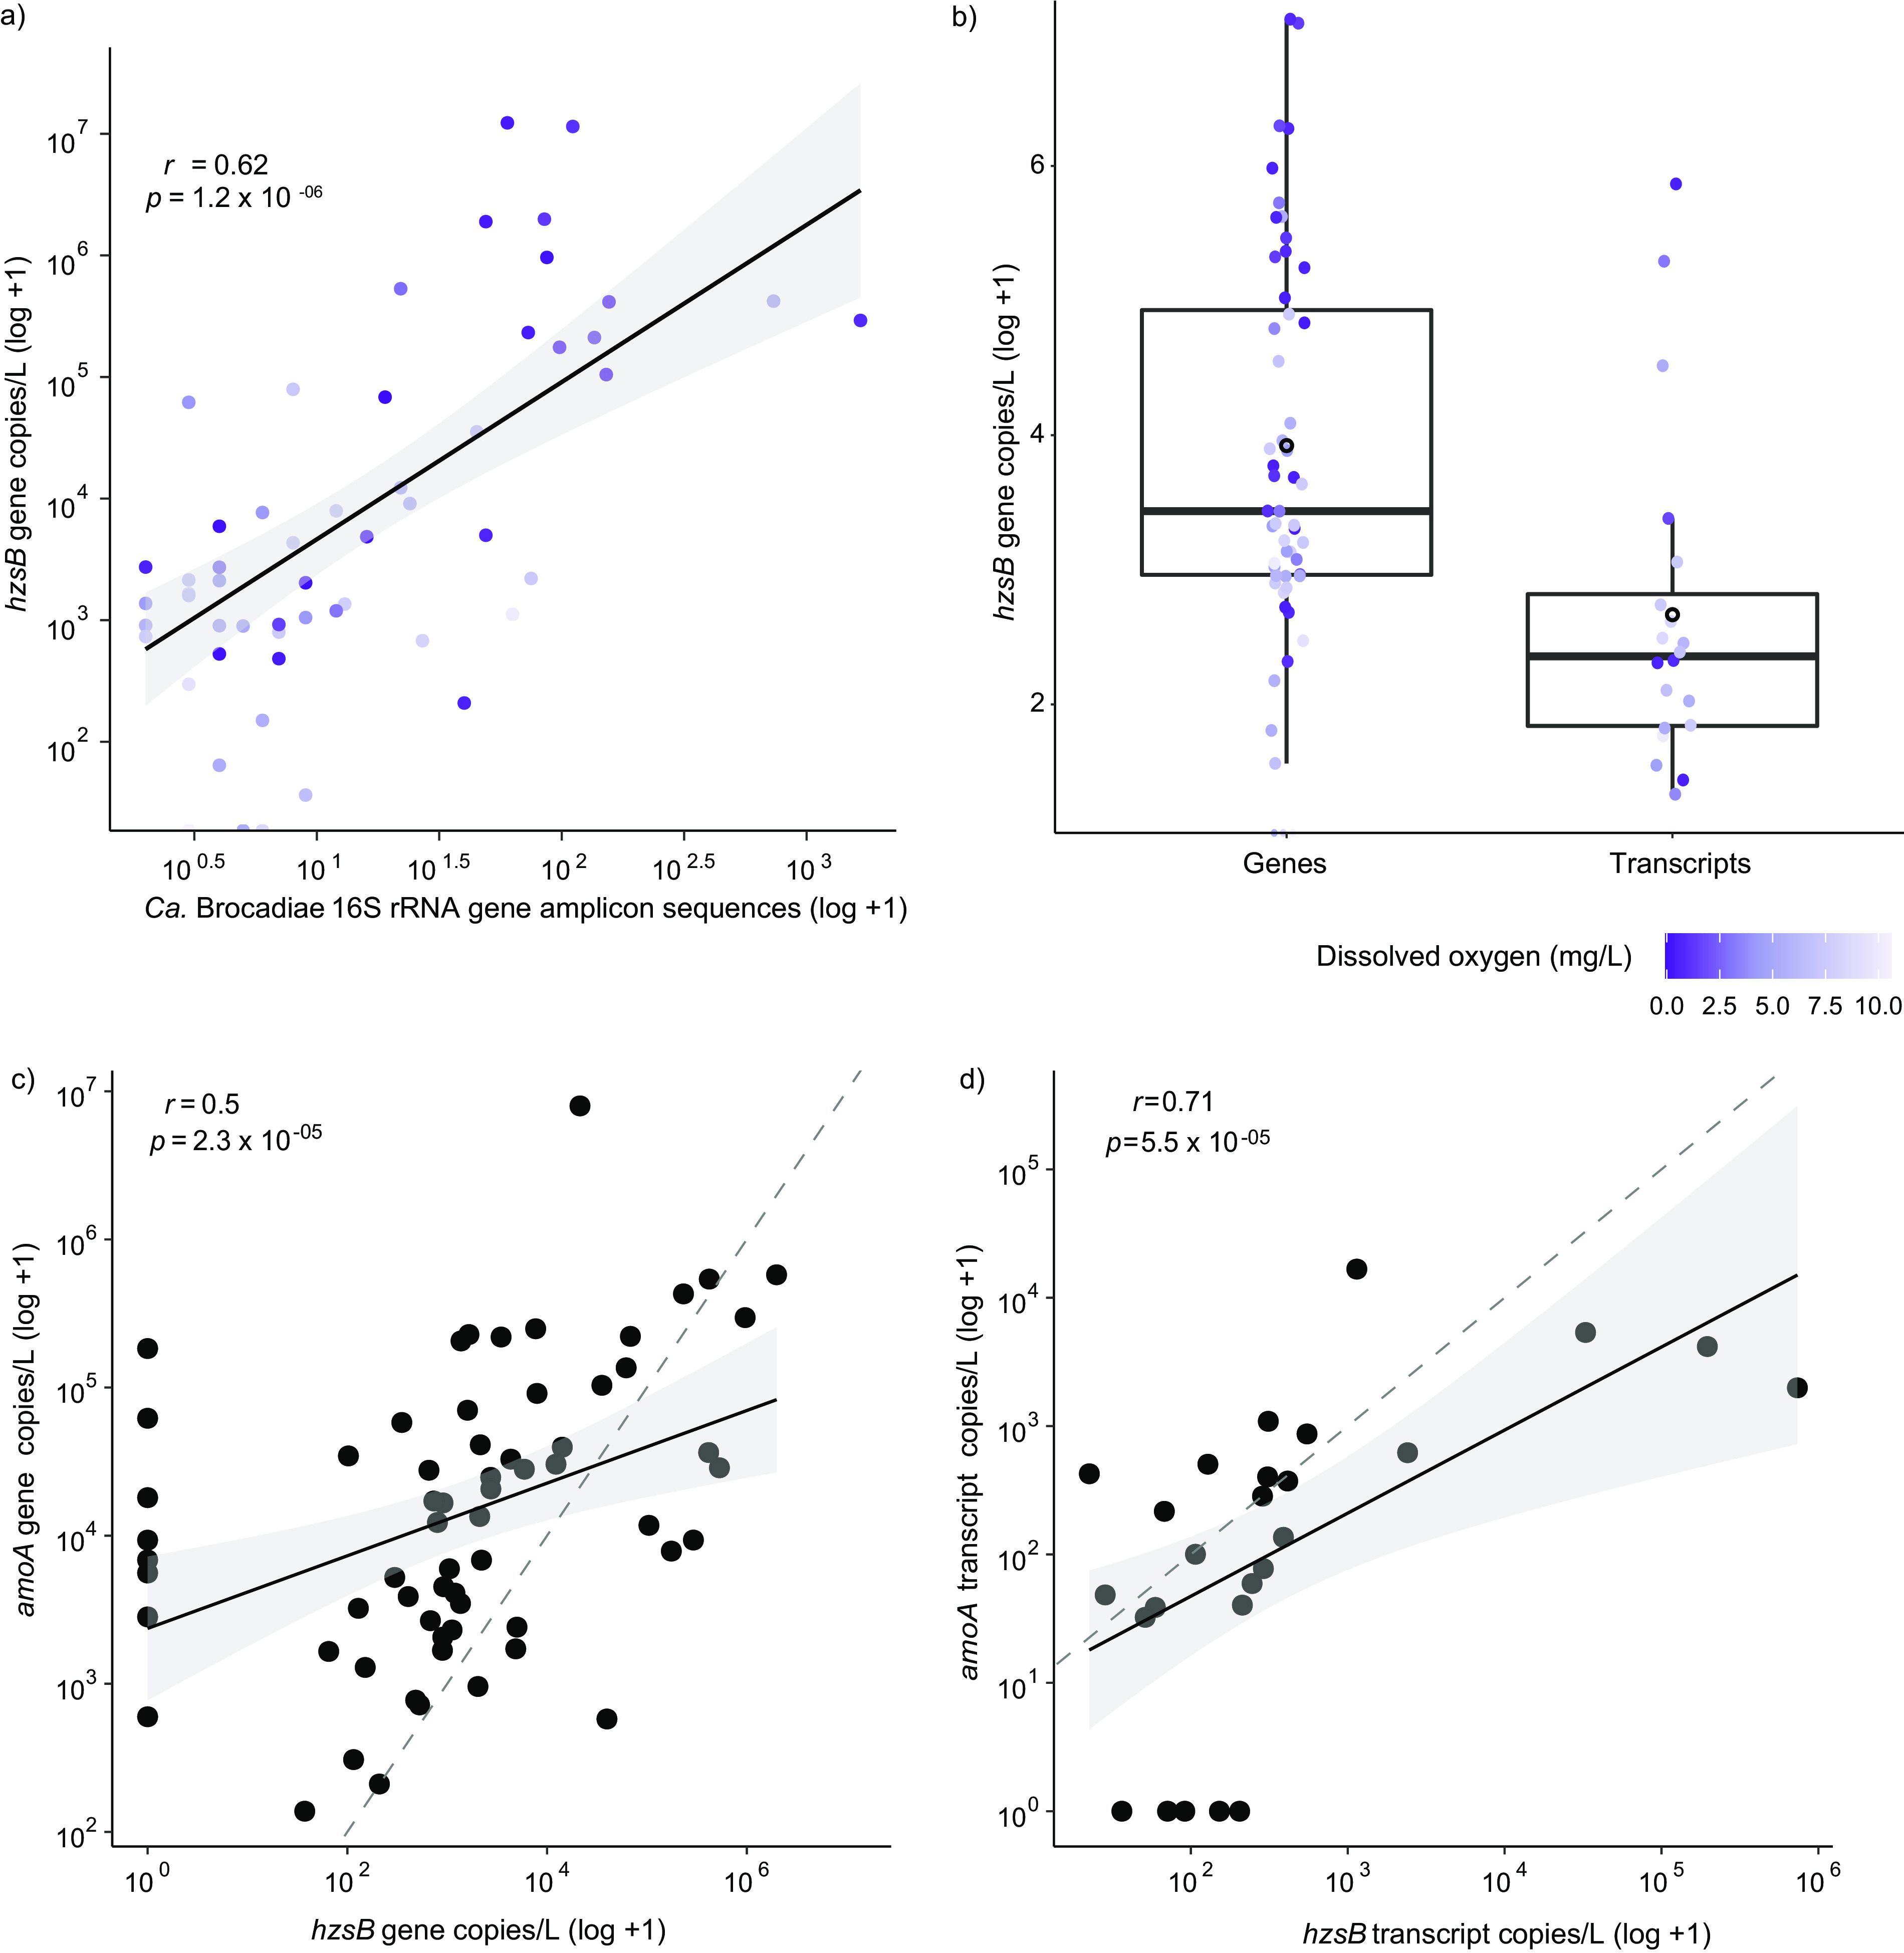
FIG 3.

Correlations between 16S rRNA gene amplicon data, aerobic ammonia oxidizers (archaea and bacteria), and abundance of hydrazine synthase genes and transcripts from ddPCR data. (a) Correlation of hzsB gene copies per liter of groundwater (log10) and number of “Ca. Brocadiae” (log10) gene amplicon sequences from the rarefied OTU table with samples containing the class “Ca. Brocadiae,” showing strong agreement between quantitative data for the hzsB anammox functional marker gene and “Ca. Brocadiae” relative abundances. (b) Box plot representing log10 abundance of hzsB genes for genes and transcripts. Black open circles represent means and horizontal lines represent the medians of gene copies per liter. Purple gradients for panels a and b correspond to DO concentration. (c) Correlation of amoA genes (log10) and hzsB genes (log10) copies per liter of groundwater using Spearman’s correlation for genetic potential (DNA). (d) Correlation of amoA genes (log10) and hzsB genes (log10) copies per liter of groundwater using Spearman’s correlation in transcripts (RNA). The gray dashed line shows the theoretical 1:1 ratio.
