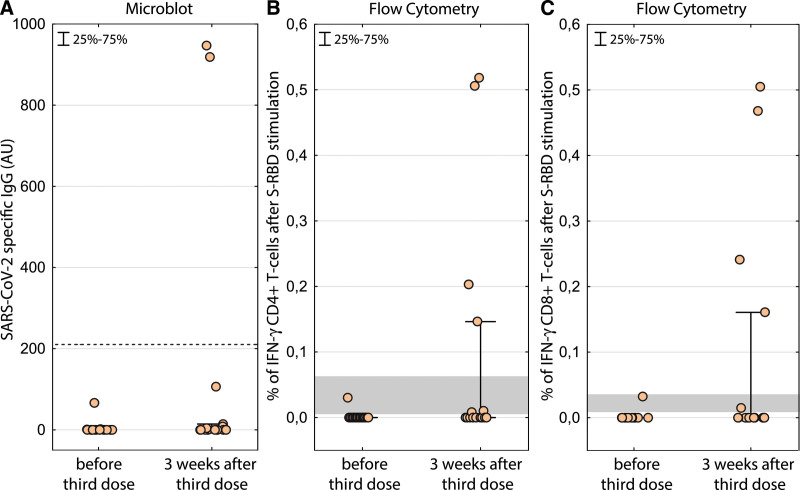
FIGURE 1.
SARS-CoV-2–specific IgG response before and after the third BNT162b2 mRNA vaccine. The dotted line shows the positivity threshold (A). SARS-CoV-2 S-RBD–specific response of CD4+ (B) and CD8+ T cells (C). The magnitude of the response is calculated as percent of interferon-γ–responding T cells after S-RBD stimulation less percent of interferon-γ without any stimulation. The gray area depicts the levels of positive response measured after second dose in a previous cohort by the same technique.2 IFN-γ, interferon-γ; IgG, immunoglobulin G; SARS-CoV-2, severe acute respiratory syndrome coronavirus 2; S-RBD, spike receptor–binding domain.

