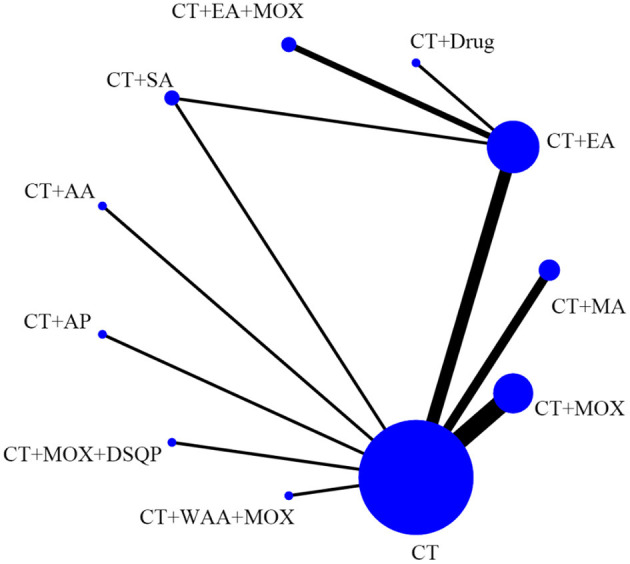
Figure 5.

Network of eligible comparisons for the network meta-analysis of RUV. Each node represents an intervention and the size of each node represents the number of randomly assigned participants. Each line represents a direct comparison between interventions and the width of the lines represents the number of studies.
