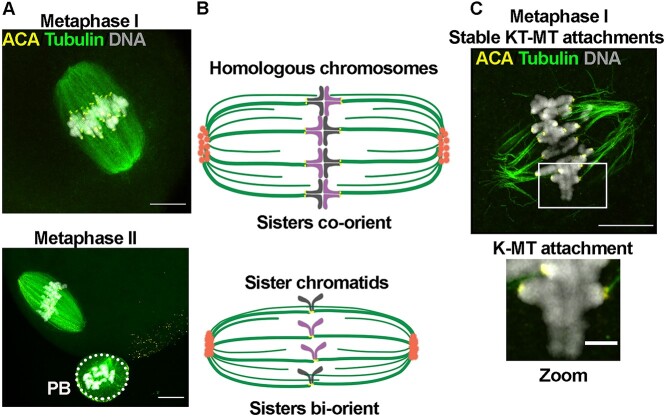
Figure 1.
Meiotic maturation in mouse oocytes. (A) Representative confocal images of mouse oocytes at metaphase I and metaphase II, (B) schematic representation of meiotic spindles in metaphase I and metaphase II, and (C) representative super-resolution confocal image of stable K-MT attachments at metaphase I. Scale bars: 10 μm and 2 μm. ACA, centromeres. PB, polar body.

