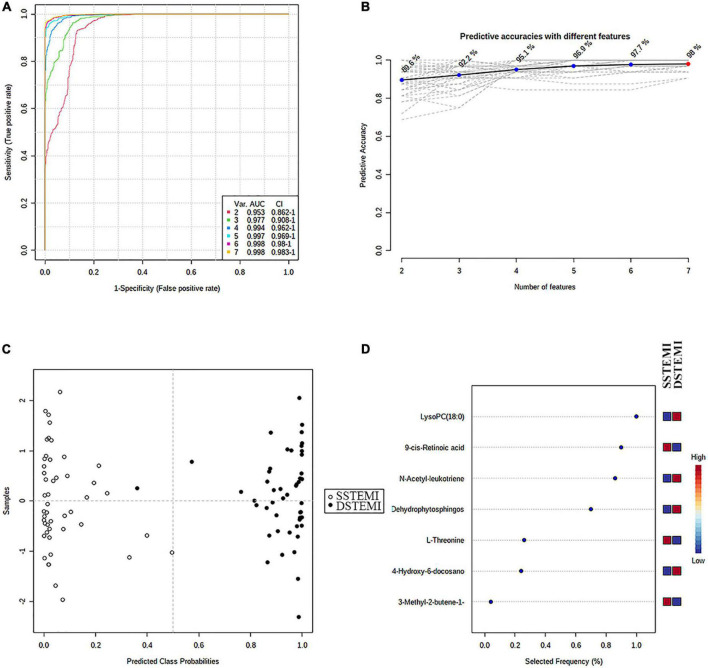
FIGURE 5.
The process of feature selection, model building, and performance evaluation performed multiple times through the Monte-Carlo cross-validation via MetaboAnalyst 5.0 (A) ROC curves of all models based on the cross-validation performance. Model 6 had the largest AUC and (B) the highest predictive accuracy. One DSTEMI sample goes into SSTEMI samples in predicted class probabilities (C). Seven significant features ranked based on their frequencies of being selected (D) during cross-validation.

