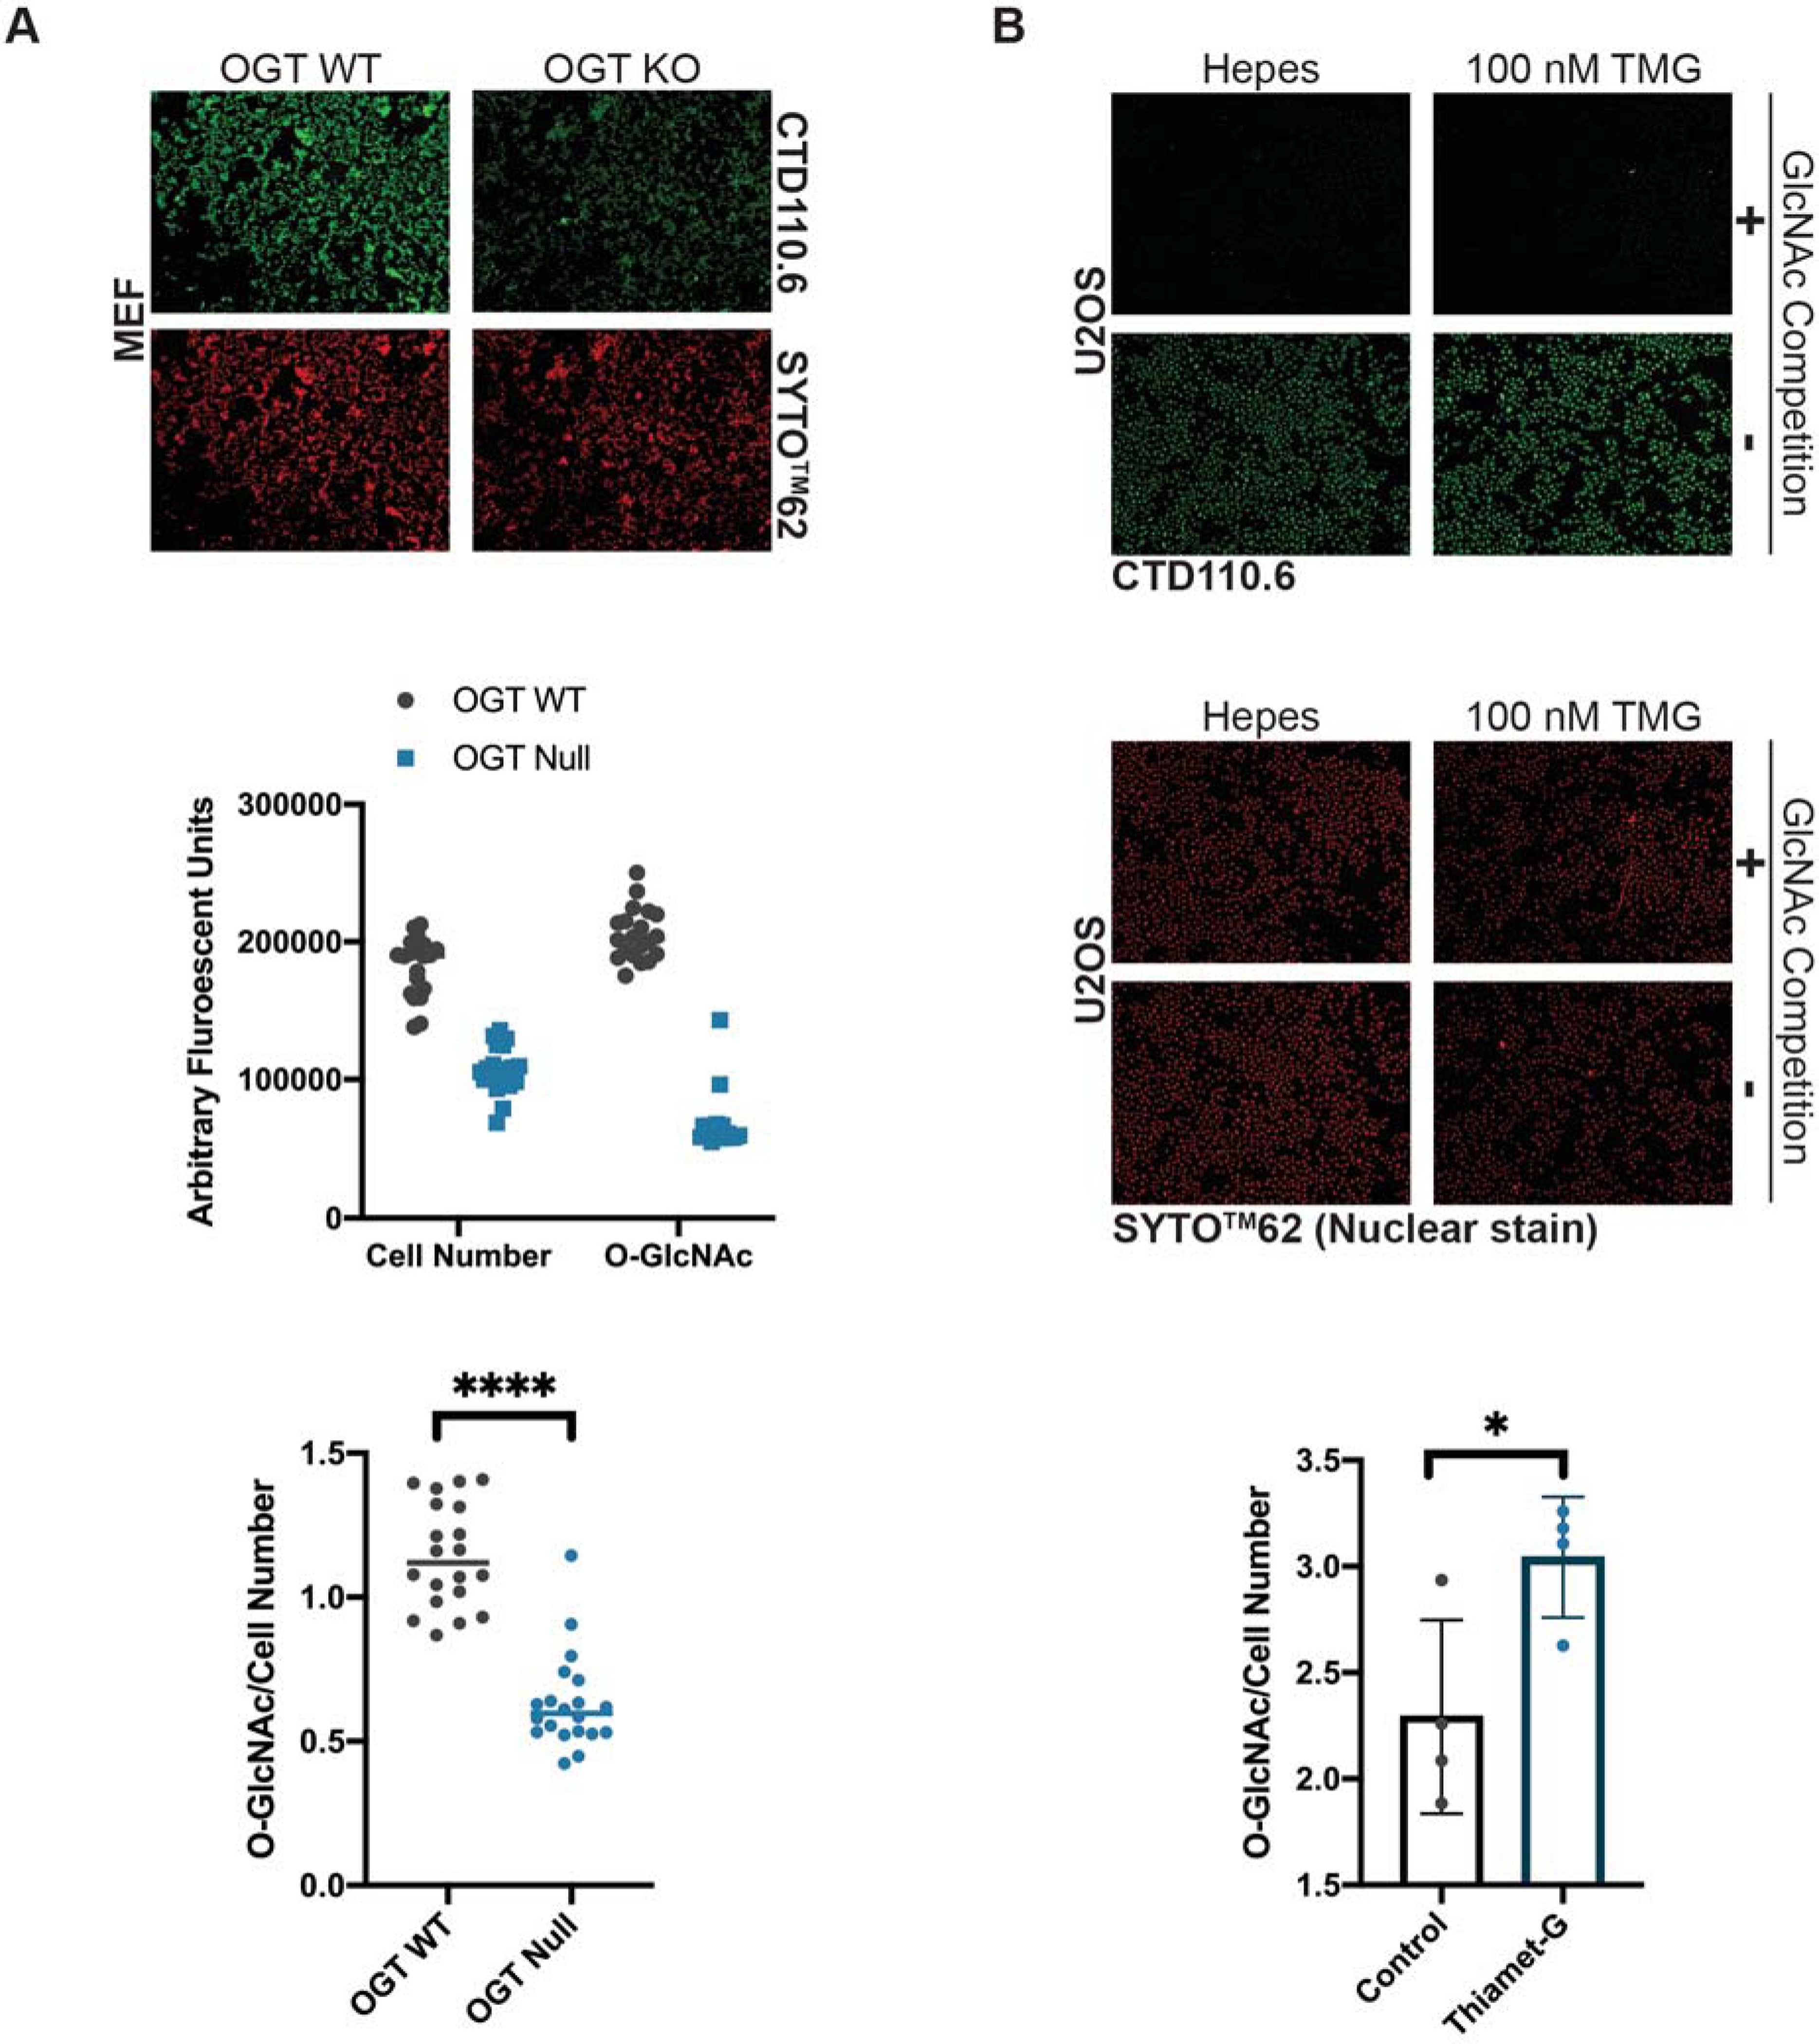
Figure 6. In Cell Western Blotting.

A) O-GlcNAc or cell number were detected in OGT WT (•, black) or null (•, blue) cells with CTD110.6 and SYTO™62. Raw fluorescent numbers for cell number and O-GlcNAc are plotted in the middle panel. O-GlcNAc levels corrected for cell number are plotted in the lower panel. P-values are the result of a student’s T-test of 20 technical replicates. **** p<0.001. B) O-GlcNAc or cell number were detected in U2OS cells treated with Vehicle (•, black) or TMG (100nM, 4h; •, blue) with CTD110.6 (upper panel) and SYTO™62 (middle panel). The O-GlcNAc signal corrected for cell number is plotted in the lower panel. Error bars represent one standard deviation. P-values are the result of a student’s T-test of 4 technical replicates. * p<0.05. Fluorescent intensity was assessed using a Molecular Devices SpectraMax i3x and fluorescent cell images (4x) with a Molecular Devices SpectraMax MiniMax 300™ Imaging Cytometer.
