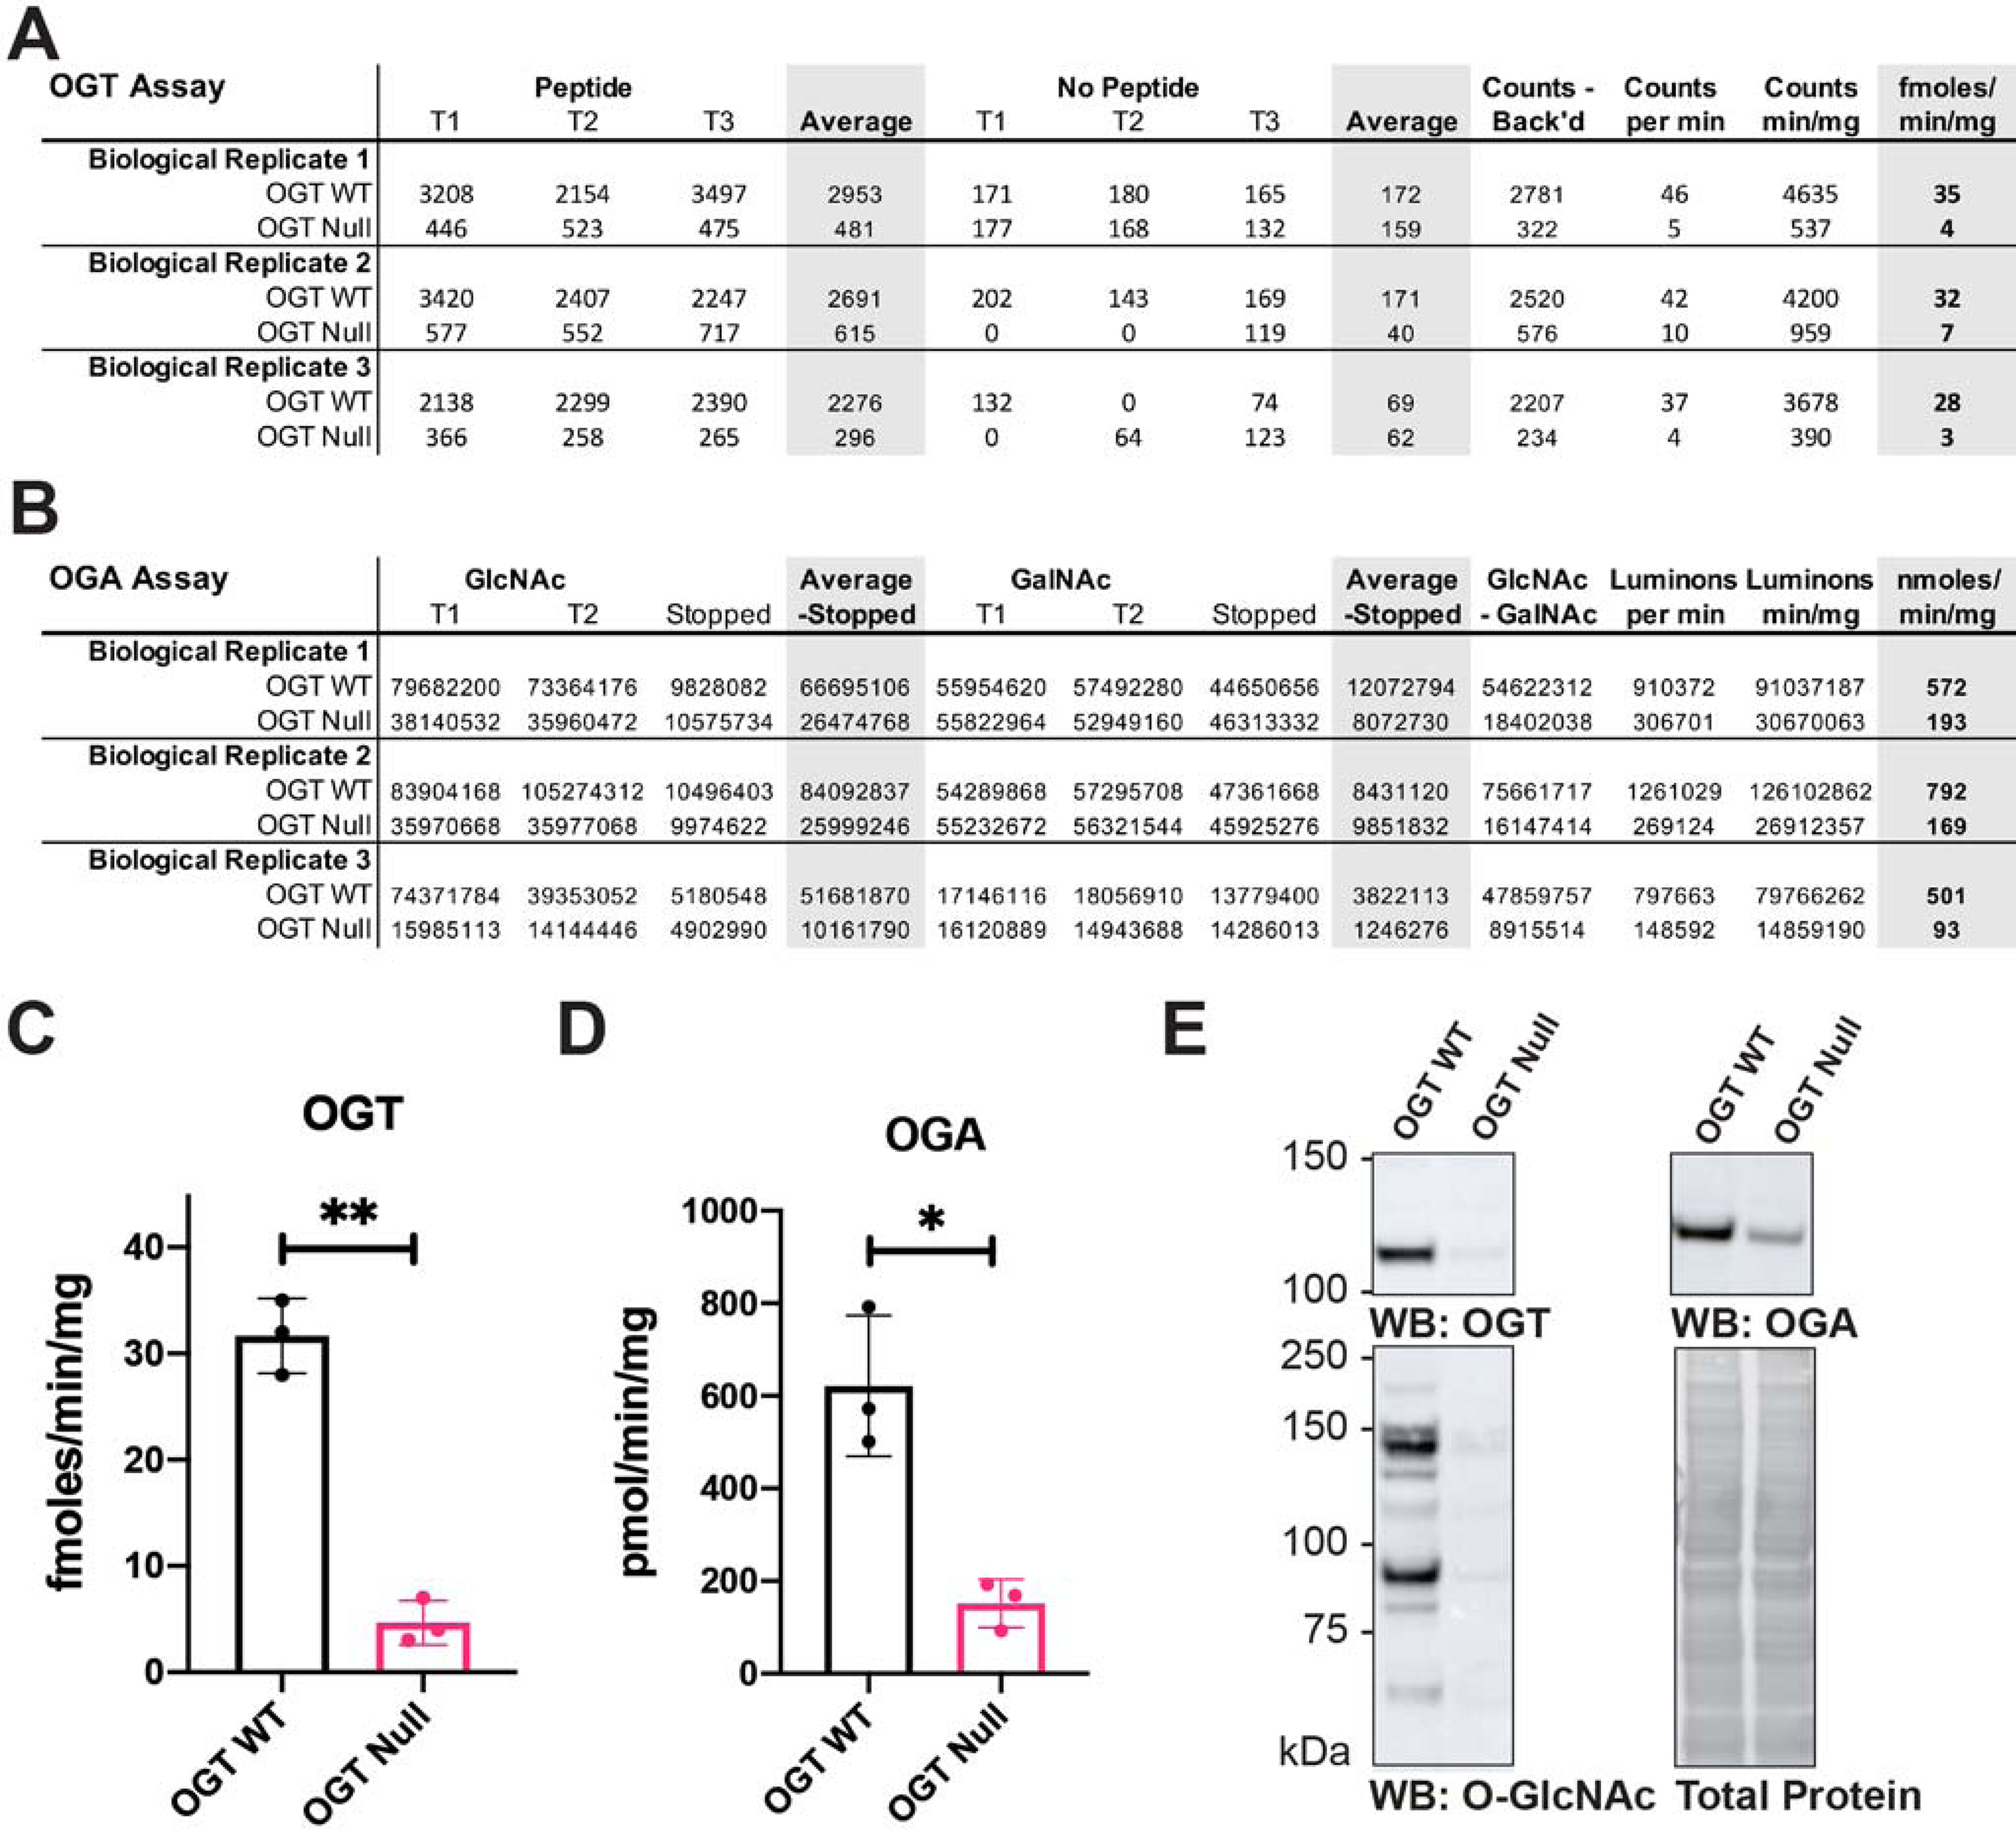
Figure 7 – Representative data from OGT and OGA assays.

A) OGT activity in 10μg of desalted lysate from OGT Wild-type (WT) and null cells was assayed in triplicate in the presence and absence of CK2 substrate peptide. The incorporation of 3H-GlcNAc was assessed using liquid scintillation counting (DPM). Activity was subsequently calculated using 10μg of protein, an assay length of 60 min, and 7.54fmol of GlcNAc per 1000 DPM. B) OGA activity in 10μg of desalted lysate from OGT Wild-type (WT) and null cells was assayed in triplicate using the pseudosubstrates 4MU-β-GlcNAc and 4MU-β-GalNAc. One replicate was stopped using glycine at time=0 (Stopped). 4MU released was assessed in a fluorescent plate reader and quantified using a 4MU standard curve. Activity was subsequently calculated using 10μg of protein, an assay length of 60 min, and 159222 luminons per nmol (experimentally derived standard curve). C) Plotted OGT activity assays. D) Plotted OGA activity assays; E. Lysates from OGT WT and Null cells (10μg) were separated by SDS-PAGE and electroblotted to nitrocellulose. The following were detected using a GE Healthcare AI600 RGB: Total Protein (Sypro™ Ruby Protein Blot stain), O-GlcNAc (CTD110.6), OGT (Sigma, DM17), and OGA (345; (Butkinaree et al., 2008)). Error bars represent one Standard Deviation. P-values are the result of a student’s T-test (2 tailed). * p<0.05, **p<0.01.
