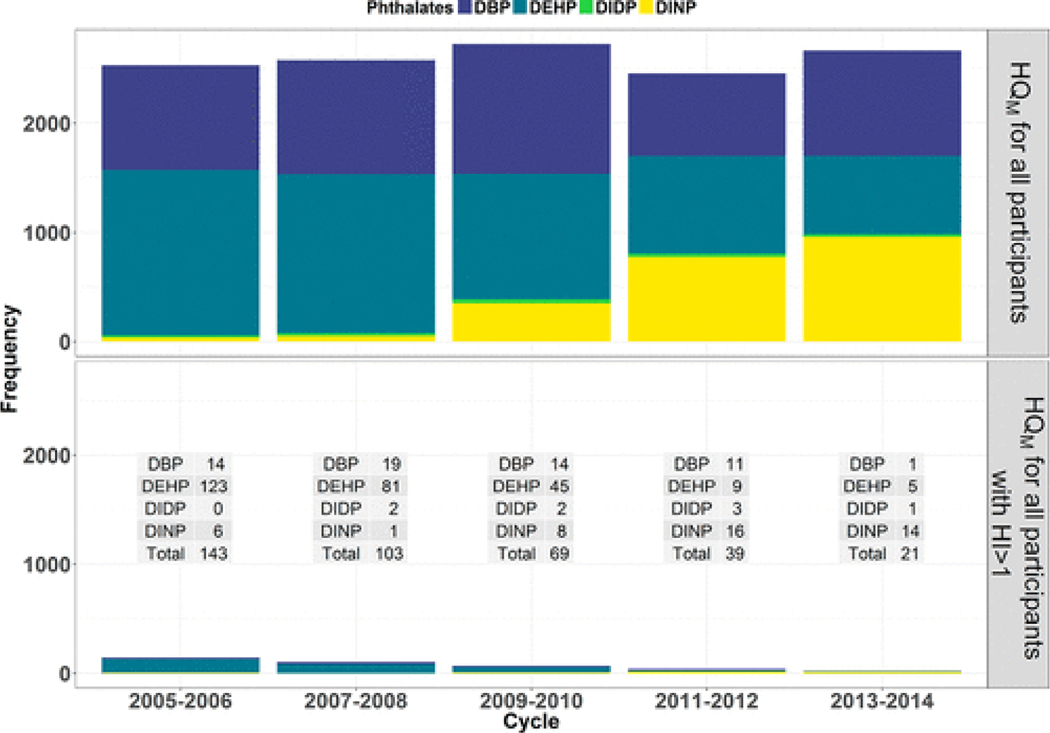
Figure 2.
Stacked bar graph displaying the frequency at which each of the six phthalates produced the maximum hazard quotient (HQM) among the NHANES participants across the cycles spanning from 2005 to 2014. The top panel presents all participants and the bottom panel subsets to participants whose hazard index (HI) is greater than one with a table inset quantifying the subset, stacked bar graph.

